Time Zone: GMT +3
Time Frame: 4 Hours (H4)
Fundamental Analysis:
The EURUSD currency pair, often referred to as “Fiber,” reflects the exchange rate between the Euro and the US Dollar. Today, the Euro may see some impact from a series of low-impact economic data releases. Germany’s Industrial Production report, forecasted at 0.1%, and Trade Balance, forecasted at 22.6B, along with France’s Trade Balance, forecasted at -5.4B, will provide insights into the economic health of the Eurozone’s largest economies. Additionally, comments from the Deutsche Bundesbank President and other minor economic indicators could influence the Euro. On the USD side, high-impact data including Average Hourly Earnings, Non-Farm Employment Change, and the Unemployment Rate are expected. These reports are critical as they provide a snapshot of the US labor market, influencing the USD significantly. A better-than-expected Non-Farm Payrolls (forecasted at 182K) and Unemployment Rate (forecasted at 3.9%) could strengthen the USD.
Price Action:
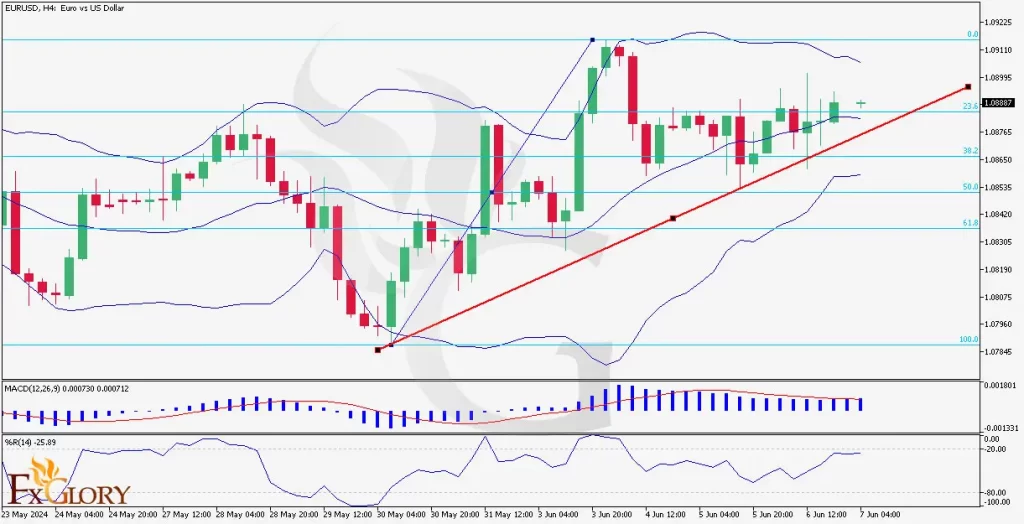
Examining the EUR/USD H4 chart price, the Fiber pair has shown a bullish trend over the past few sessions. The price has been moving within an ascending channel, staying above the key support trendline. The recent EUR USD price action indicates a series of higher highs and higher lows, with the price touching the middle Bollinger Band and moving in the upper half of the bands, signifying bullish momentum. The last five candles have been mainly bullish, suggesting positive market sentiment.
Key Technical Indicators:
Bollinger Bands: The EURUSD chart’s Bollinger Bands have been getting tighter, indicating decreased volatility. The price has been trading in the upper half of the bands and touching the middle band, showing a positive trend with potential for upward movement. The recent bullish candles support this momentum.
MACD (Moving Average Convergence Divergence): The MACD line is slightly above the signal line, with a positive histogram, indicating bullish momentum. However, the momentum appears to be stabilizing, suggesting traders should watch for any potential crossover that could signal a change in trend.
Williams %R: The Williams %R indicator is currently showing a value close to -20, indicating that the pair is near overbought conditions. This suggests caution as there might be a potential pullback or consolidation before the next significant move.
Support and Resistance:
Support: Immediate support is located at 1.0850, aligning with the ascending trendline and a recent price consolidation area.
Resistance: The nearest resistance level is at 1.0925, which coincides with recent highs and the upper boundary of the Bollinger Bands.
Conclusion and Considerations:
The EURUSD H4 chart analysis shows sustained bullish momentum, supported by key technical indicators such as Bollinger Bands, MACD, and Williams %R. The EUR-USD’s current price action within the ascending channel indicates that the bulls are in control. However, the narrowing Bollinger Bands and the overbought signal from Williams %R suggest caution. Traders should monitor today’s economic data releases, especially from the US, as they could significantly impact the pair’s direction. Given the upcoming high-impact US data, increased volatility is expected.
Disclaimer: The EUR/USD provided chart analysis is for informational purposes only and does not constitute investment advice. Traders should conduct their own research and analysis before making any trading decisions. Market conditions can change rapidly, and it is essential to stay updated with the latest information.


