Time Zone: GMT +3
Time Frame: 4 Hours (H4)
Fundamental Analysis:
Gold, also known as XAU/USD, continues to be influenced by a mix of economic data and geopolitical factors. Recent data from the United States, including robust employment figures and persisting inflation concerns, has kept the Federal Reserve on a path of potential interest rate hikes, strengthening the US Dollar and exerting downward pressure on gold. Furthermore, geopolitical uncertainties, particularly in Europe and Asia, add to the volatility, with investors often seeking gold as a safe-haven asset during times of heightened uncertainty. This context provides crucial insights into the XAU/USD technical analysis today live, offering a broader understanding of the current market dynamics.
Price Action:
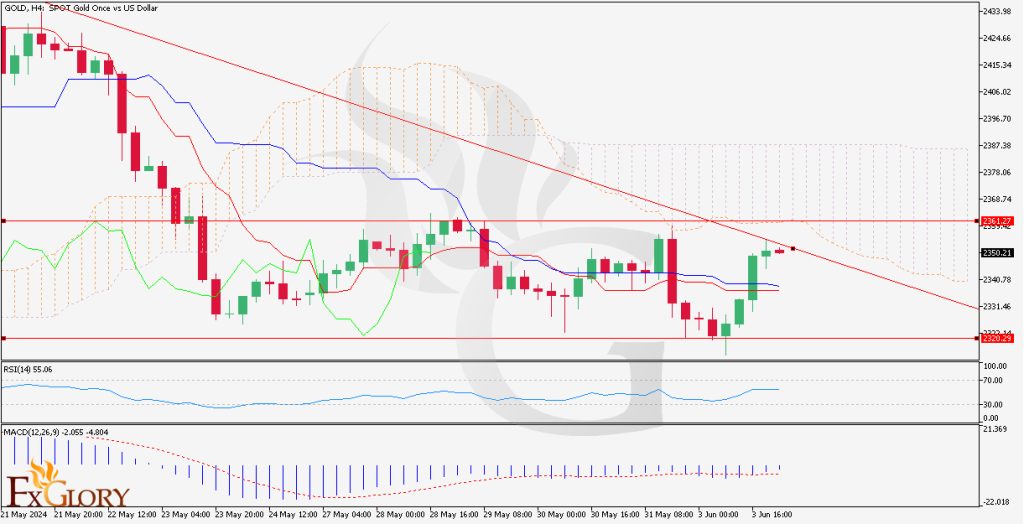
The H4 timeframe for XAU/USD shows a predominantly bearish trend. The price action has been characterized by lower highs and lower lows, indicating sustained downward momentum. Despite occasional attempts to break above resistance levels, the price remains constrained below the Ichimoku cloud and a descending trendline, reinforcing the bearish sentiment. Observing the gold news today, it is evident that these factors are shaping the current price movement.
Key Technical Indicators:
Ichimoku Cloud:
The price is trading below the Ichimoku cloud, signaling a bearish outlook as the cloud acts as a major resistance zone. This aligns with the gold forecast news live, suggesting a continuation of the bearish trend.
MACD (Moving Average Convergence Divergence):
The MACD histogram is negative, with the MACD line below the signal line, indicating ongoing bearish momentum and potential for further price declines.
RSI (Relative Strength Index):
The RSI is at 55.30, suggesting a neutral to slightly bearish sentiment. The indicator shows room for the price to decline further before reaching oversold conditions.
Support and Resistance:
Support Levels:
Immediate support is found at 2333.73 and 2320.29. A break below these levels could lead to a decline towards 2302.93.
Resistance Levels:
Key resistance levels are located at 2350.54 and 2366.77. A sustained move above these levels could challenge the prevailing bearish trend.
Conclusion and Consideration:
The XAU/USD pair on the H4 chart exhibits a strong bearish trend, with key technical indicators confirming downward momentum. The price remains below significant resistance levels, including the Ichimoku cloud and descending trendline. Traders should monitor economic data releases and geopolitical developments closely, as these can impact gold prices significantly. In the current environment, considering short positions while setting appropriate stop-loss levels to manage risk could be prudent. Watch for any signs of trend reversals, especially if the price begins to break above key resistance levels. Keeping up with the gold forecast news live and XAU/USD technical analysis today will be essential for making informed trading decisions.
Disclaimer: The provided analysis is for informational purposes only and does not constitute investment advice. Traders should conduct their own research and analysis before making any trading decisions.