Time Zone: GMT +3
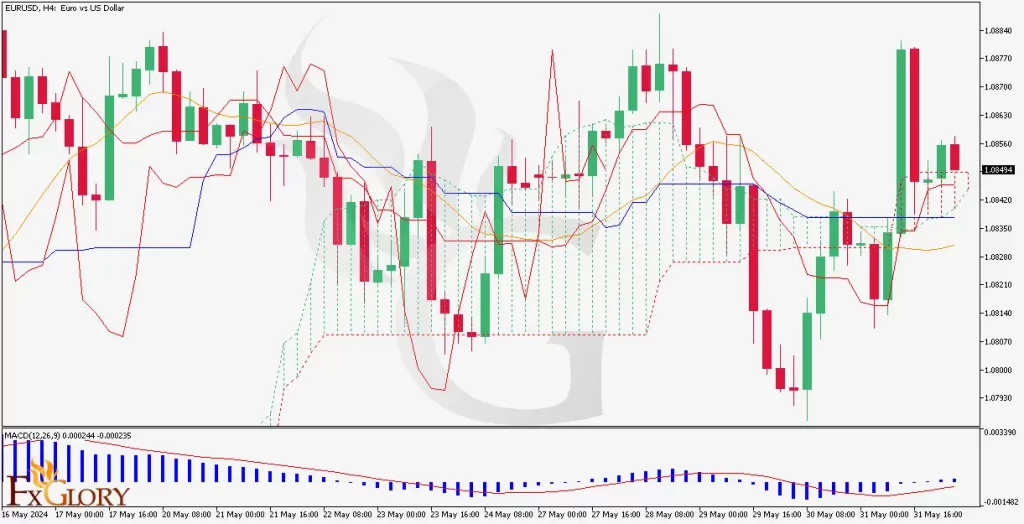
Time Frame: 4 Hours (H4)
Fundamental Analysis:
The EUR/USD currency pair is influenced by various economic data releases today. Key among these is the Eurozone Retail Sales report, which is expected to show a 0.3% increase. A higher-than-expected result would be positive for the Euro. Additionally, other data such as German Factory Orders, Eurozone GDP, and various CPI figures will be released, though these are expected to have a moderate impact. On the US side, the Non-Farm Payrolls report and the Unemployment Rate are crucial indicators, with the NFP forecasted at 200K, indicating steady job growth, which could influence the USD.
Price Action:
The EUR/USD forex pair has been experiencing a bearish trend in the H4 timeframe. The price has recently retraced but remains above the critical support levels, suggesting the potential for continued downward movement. The recent candles show a consolidation phase, with the price moving towards the lower band of the Bollinger Bands.
Key Technical Indicators:
Ichimoku:
The Ichimoku Cloud analysis shows a bearish signal as the last cloud is red, indicating a negative outlook. Both the conversion line (Tenkan-sen) and the base line (Kijun-sen) are below the candles, which supports the bearish sentiment.
MACD (Moving Average Convergence Divergence):
The MACD line is below the histogram, indicating bearish momentum and suggesting a downward trend. The histogram also shows increasing bearish momentum, reinforcing the possibility of further declines.
Elliott Wave Analysis:
The Elliott Wave analysis for EUR/USD indicates that the pair is in a corrective phase. The recent waves suggest that the pair might continue its downward trajectory before completing the current wave structure.
Support and Resistance:
Support Levels:
Immediate support is at 1.0800, which aligns with the recent price action and the lower boundary of the Ichimoku Cloud. Further support is found at 1.0750, coinciding with previous swing lows.
Resistance Levels:
Immediate resistance is at 1.0900, where the recent highs align with the upper Bollinger Band. Further resistance is at 1.0950, the recent peak and psychological level.
Conclusion and Consideration:
The EUR/USD pair on the H4 chart shows a predominantly bearish trend with temporary consolidation. Key technical indicators such as the Ichimoku Cloud, MACD, and Elliott Wave analysis support the likelihood of continued downward movement. Traders should monitor upcoming economic data releases from the Eurozone and the US, as they could introduce volatility and influence the pair’s direction.
Disclaimer: The provided EUR/USD analysis is for informational purposes only and does not constitute investment advice. Traders should conduct their own research and analysis of the EUR/USD forex pair before making any trading decisions. Market conditions can change rapidly, and it is essential to stay updated with the latest information.
FxGlory
3.06.2024