Time Zone: GMT +3
Time Frame: 4 Hours (H4)
Fundamental Analysis:
The EUR/JPY currency pair chart is expected to be influenced by several economic data releases today. Key among these is the French Final Private Payrolls report, which is forecasted to show a 0.2% increase. A higher than expected result would be positive for the Euro. Additionally, other data such as German Import Prices, German Retail Sales, French Consumer Spending, and various CPI figures will be released, though these are expected to have low impact. On the Japanese side, the Tokyo Core CPI y/y is forecasted at 1.9%, indicating mild inflation pressures, which could influence the JPY.
Price Action:
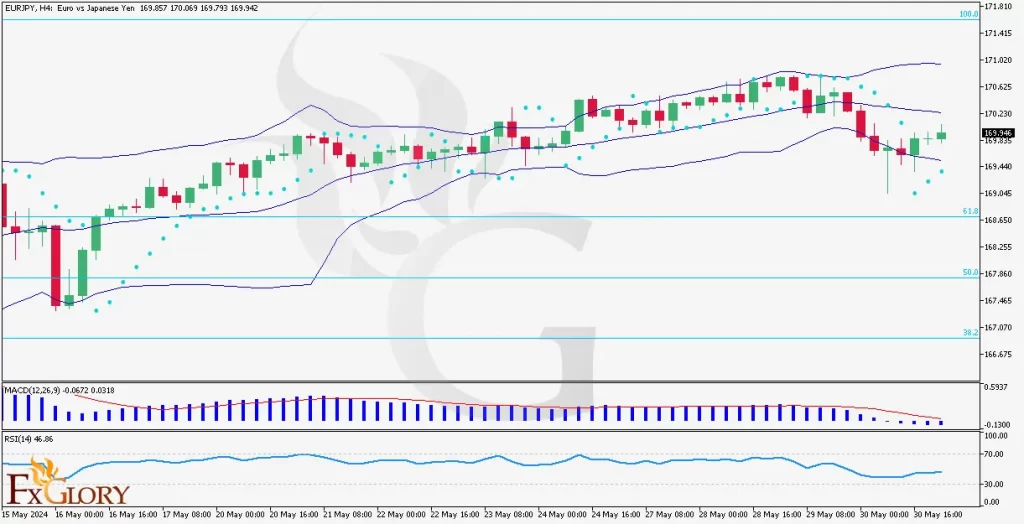
The EUR JPY forex pair has been experiencing a gradual bullish trend in the H4 timeframe. The price has recently retraced but remains above the critical support levels, suggesting the potential for continued upward movement. The recent candles show a consolidation phase, with the price moving towards the middle band of the Bollinger Bands.
Key Technical Indicators:
Bollinger Bands:
The Bollinger Bands are widening, indicating increased volatility. The EUR-JPY price has been mostly moving between the middle and upper bands, showing bullish momentum. The last few candles of EURJPY suggest a retracement towards the middle band, but the overall direction remains upwards.
Parabolic SAR:
The Parabolic SAR dots are currently positioned below the candles, which is a bullish signal. This indicator supports the ongoing upward trend, as the last three dots confirm the bullish stance.
MACD (Moving Average Convergence Divergence):
The MACD line is slightly above the signal line, and the histogram shows decreasing bearish momentum in EUR/JPY price. This suggests that the bullish trend might be losing some strength, but it is not yet reversing. Traders should watch for a potential bullish crossover which could reaffirm the uptrend.
RSI (Relative Strength Index):
The RSI is at 46.86, indicating a neutral stance. This suggests that there is room for further upward movement before reaching overbought conditions. The RSI supports the current consolidation phase within the broader bullish trend.
Support and Resistance:
Support Levels:
Immediate support is at 169.000, which aligns with the 61.8% Fibonacci retracement level and recent price action od EURJPY. Further support is found at 167.860, coinciding with the 50% Fibonacci retracement.
Resistance Levels:
Immediate resistance is at 170.825, where the recent highs align with the upper Bollinger Band.
Further resistance is at 171.415, the recent peak and 100% Fibonacci extension.
Conclusion and Consideration:
The EURJPY pair on the H4 chart shows a predominantly bullish trend with temporary consolidation. Key technical indicators such as the Bollinger Bands, Parabolic SAR, MACD, and RSI support the likelihood of continued upward movement, though with some caution due to the consolidation phase. Traders should monitor upcoming economic data releases from the Eurozone and Japan, as they could introduce volatility and influence the pair’s direction.
Disclaimer: The provided EURJPY analysis is for informational purposes only and does not constitute investment advice. Traders should conduct their own research and analysis of EURJPY forex pair before making any trading decisions. Market conditions can change rapidly, and it is essential to stay updated with the latest information.