Time Zone: GMT +3
Time Frame: 4 Hours (H4)
Fundamental Analysis:
The AUDUSD currency pair chart represents the exchange rate between the Australian Dollar (AUD) and the US Dollar (USD). This pair is highly influenced by economic indicators from both Australia and the United States, making it a critical focus for forex traders. Monitoring the AUD/USD chart price is essential for understanding market trends and potential trading opportunities in the forex market. Today, the Australian Dollar (AUD) is influenced by low-impact economic events. RBA Assistant Governor Sarah Hunter’s speech is unlikely to introduce significant market volatility but could offer subtle insights into future monetary policy. Additionally, data on Building Approvals (forecasted at 1.8%) and Private Capital Expenditure (forecasted at 0.6%) are due, which are essential indicators of economic health, though they are expected to have low impact. In contrast, the US Dollar (USD) faces high-impact events including Preliminary GDP data (forecasted at 1.2%), Unemployment Claims (forecasted at 218K), and Pending Home Sales (forecasted at -1.1%). These events are pivotal and could induce substantial market movements, reflecting the USD’s overall economic health.
Price Action:
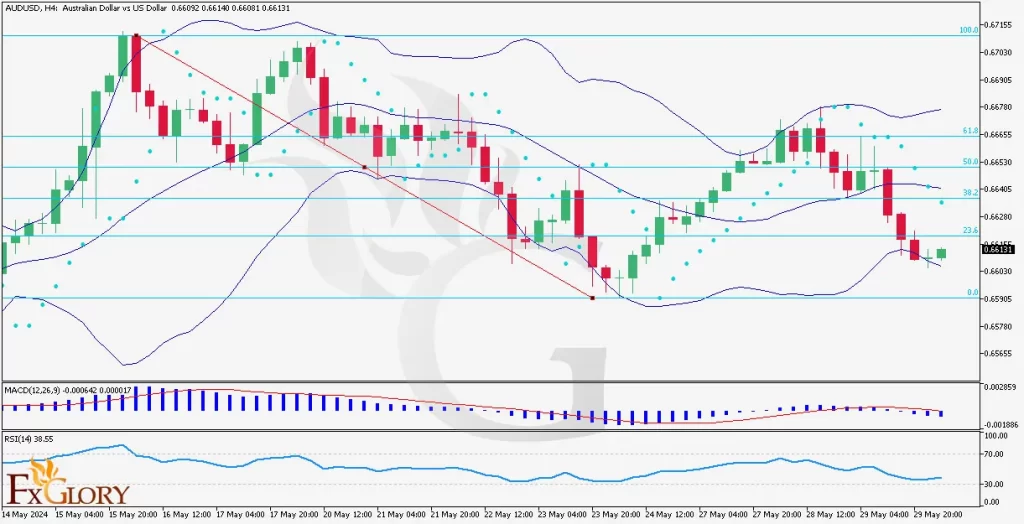
AUDUSD On the H4 timeframe, has been displaying a mix of bearish and bullish sentiments. Over the last five candles, three were bearish, showing a downward trend, while the last two candles are bullish, suggesting a potential reversal. This AUD/USD price action is notable as it indicates a shift in market sentiment with the possibility of further upward movement of the AUD USD chart price if the bullish momentum continues.
Key Technical Indicators:
Bollinger Bands: The bands are widening smoothly, indicating increased volatility. The last five candles have been moving in the lower part of the bands, showing a bearish trend. However, the last two bullish candles suggest a possible upward correction or reversal in the AUD-USD price.
Parabolic SAR: The Parabolic SAR dots have been above the candles for the last 10 spots, which is a bearish signal. This indicates that the market is still in a downtrend, but traders should watch for any shift below the price, which would indicate a potential trend reversal.
MACD (Moving Average Convergence Divergence): The MACD line is below the signal line, and both are below the zero line, reflecting bearish momentum. However, the histogram shows a slight decrease in bearish pressure, hinting at a potential bullish crossover if the current trend continues.
RSI (Relative Strength Index): The RSI is at 38.55, indicating that the AUDUSD is approaching oversold territory. This level suggests a potential for an upward correction if the buying pressure increases.
Support and Resistance:
Support Levels: The immediate support is at 0.6580, a psychological level and a recent low. Below this, further support can be found at 0.6560.
Resistance Levels: The nearest resistance is at 0.6640, a level tested by recent price action. Above this, significant resistance lies at 0.6685, aligned with the 50% Fibonacci retracement level.
Conclusion and Consideration:
The AUDUSD on the H4 chart shows mixed signals. The widening Bollinger Bands suggest increased volatility, and the Parabolic SAR indicates a prevailing bearish trend. However, the recent bullish candles, combined with an RSI approaching oversold levels, and a potentially converging MACD, hint at a possible upward correction. Traders should closely monitor upcoming US economic data releases, as they are likely to drive significant market movements. It’s prudent to consider both bullish and bearish scenarios, implementing appropriate risk management strategies.
Disclaimer: The provided AUDUSD chart analysis is for informational purposes only and does not constitute investment advice. Traders should conduct their own research and analysis before making any trading decisions. Market conditions can change rapidly, and it is essential to stay updated with the latest information.