Time Zone: GMT +2
Time Frame: 4 Hours (H4)
Fundamental Analysis:
Economic indicators from Canada and the United States continue to play a significant role in influencing the USD/CAD exchange rate. Key data such as employment reports, inflation rates, and central bank statements should be closely monitored. For instance, changes in oil prices significantly impact the Canadian dollar due to Canada’s substantial oil exports. Meanwhile, economic recovery signals from the U.S., including GDP growth or Federal Reserve policy shifts, could sway USD strength. Traders should stay attuned to these economic releases to gauge potential impacts on currency movements.
Price Action:
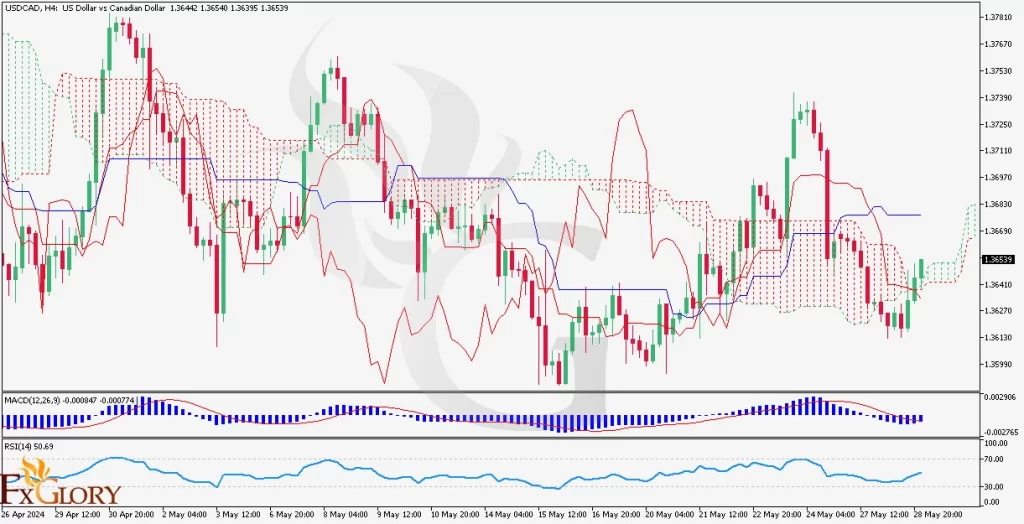
The USD/CAD chart shows a bearish sentiment as the price remains below the Ichimoku Cloud. This alignment typically indicates a continuation of the downward trend, with the cloud acting as resistance in the near term. The candles being consistently below the cloud without any significant bullish breakouts suggest that the bearish momentum is strong. Traders should watch for any candle formations or price actions that might indicate a potential reversal or stabilization.
Key Technical Indicators:
MACD: The Moving Average Convergence Divergence (MACD) indicator is below the histogram, which typically suggests a bearish momentum. However, a closer inspection reveals that the MACD line is showing signs of leveling off, which might hint at a potential slowdown in the bearish momentum or a stabilization of prices..
RSI: The Relative Strength Index (RSI) is above 50, hovering around 50.69, which indicates a mild bullish undercurrent or at least a reduction in bearish momentum. This suggests that while the market has been bearish, there may be potential for some stabilization or a mild upward correction.
Ichimoku Kinko Hyo: The USD/CAD chart shows that the candles are currently below the Ichimoku Cloud, suggesting a bearish trend. The green cloud indicates potential support levels below the current price, but as long as prices remain below the cloud, the overall market sentiment remains bearish.
Support and Resistance Levels:
Support: The immediate support can be identified by the lower boundary of the Ichimoku Cloud and the recent lows around the 1.36300 level.
Resistance: Resistance is likely formed by the base of the Ichimoku Cloud above the current price level, around 1.36900. Prices would need to break above the cloud to indicate a shift to a bullish outlook.
Conclusion:
While the market shows a bearish trend with prices below the Ichimoku Cloud and MACD below the histogram, the RSI above 50 suggests some resistance to further downward movement. Traders should watch for potential signs of a bullish reversal if the price attempts to break above the Ichimoku Cloud. However, until such a breakout occurs, the bearish sentiment is likely to prevail.
Disclaimer: This analysis is for informational purposes only and does not constitute investment advice. Traders should conduct their own research and analysis before making any trading decisions.
FxGlory
29.05.2024