Time Zone: GMT +3
Time Frame: 4 Hours (H4)
Fundamental Analysis:
The USD/JPY currency pair reflects the exchange rate between the US Dollar (USD) and the Japanese Yen (JPY). Today, the USD is expected to experience low liquidity due to a Bank Holiday in observance of Memorial Day. This typically leads to irregular volatility and less market activity, as US banks will be closed. On the other hand, significant volatility is anticipated for the JPY with Bank of Japan (BOJ) Governor Kazuo Ueda scheduled to speak. Traders will scrutinize his speech for clues on future monetary policy and interest rate changes, which could impact the value of the JPY currency.
Price Action:
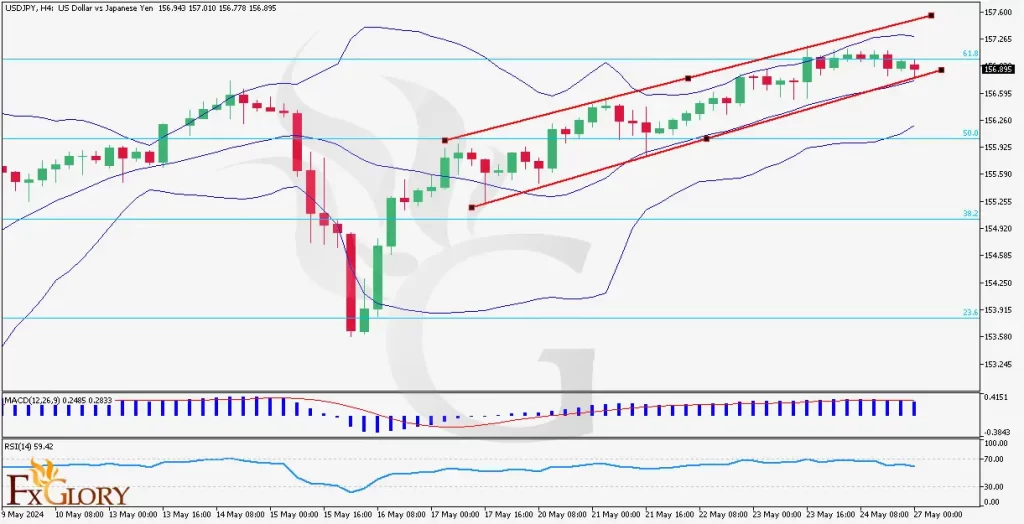
The USDJPY pair analysis in the H4 timeframe shows a clear bullish trend. Over the past 10 days, the USD-JPY pair’s price has been moving within an ascending channel. Recently, the price has been closer to the middle Bollinger Band line, suggesting a potential consolidation phase. The last five candles indicate a minor pullback, but the price remains within the upper half of the Bollinger Bands, maintaining a bullish stance.
Key Technical Indicators:
Bollinger Bands: Analyzing the USDJPY’s key technical indicators, the Bollinger Bands have been narrowing, which often precedes a period of low volatility followed by a breakout. The USD JPY’s price has been moving in the upper half of the Bands for the last 10 days, and in the last five candles, it’s getting closer to the middle line but remains above it, indicating ongoing bullish momentum albeit with caution for potential consolidation.
MACD (Moving Average Convergence Divergence): The MACD line is slightly above the signal line but the histogram shows decreasing momentum. This suggests that while the bullish trend is intact, the buying pressure may be weakening. Traders should watch for a potential bearish crossover which could indicate a shift in momentum.
RSI (Relative Strength Index): The RSI is currently at 59.42, below the overbought level of 70. This indicates that there is still room for the price to move higher before hitting overbought conditions. The RSI supports the ongoing bullish trend but suggests that the market is not yet overextended.
Support and Resistance:
Support: Immediate support is located at 156.300, which aligns with the middle Bollinger Band and a recent price consolidation area.
Resistance: The nearest resistance level is at 157.600, which coincides with the upper boundary of the ascending channel and recent highs.
Conclusion and Consideration:
The USDJPY pair on the H4 chart forecast shows sustained bullish momentum, supported by the Bollinger Bands, MACD, and RSI indicators. The USDJPY’s current price action within the ascending channel indicates that the bulls are still in control, though the narrowing Bollinger Bands and weakening MACD histogram suggest caution. Traders should be mindful of the potential for increased volatility due to the BOJ Governor’s speech, which could impact the JPY significantly. Given the upcoming US Bank Holiday, liquidity might be low, leading to irregular volatility.
Disclaimer: The USD-JPY’s provided analysis is for informational purposes only and does not constitute investment advice. Traders should conduct their own research and analysis of USDJPY before making any trading decisions. Market conditions can change rapidly, and it is essential to stay updated with the latest information.