Time Zone: GMT +3
Time Frame: 4 Hours (H4)
Fundamental Analysis:
The USD/SEK pair is influenced by economic factors such as interest rate decisions by the Federal Reserve and the Riksbank, as well as broader economic indicators from the United States and Sweden. Recently, the Federal Reserve’s cautious stance on interest rate hikes has created uncertainty in the market, impacting the USD. Meanwhile, Sweden’s economic performance has been robust, with recent data showing strong GDP growth and low unemployment rates. These factors contribute to the SEK’s strength. Traders should keep an eye on upcoming economic reports, including US GDP figures and Swedish industrial production data, as these can provide further direction for the USD/SEK pair.
Price Action:
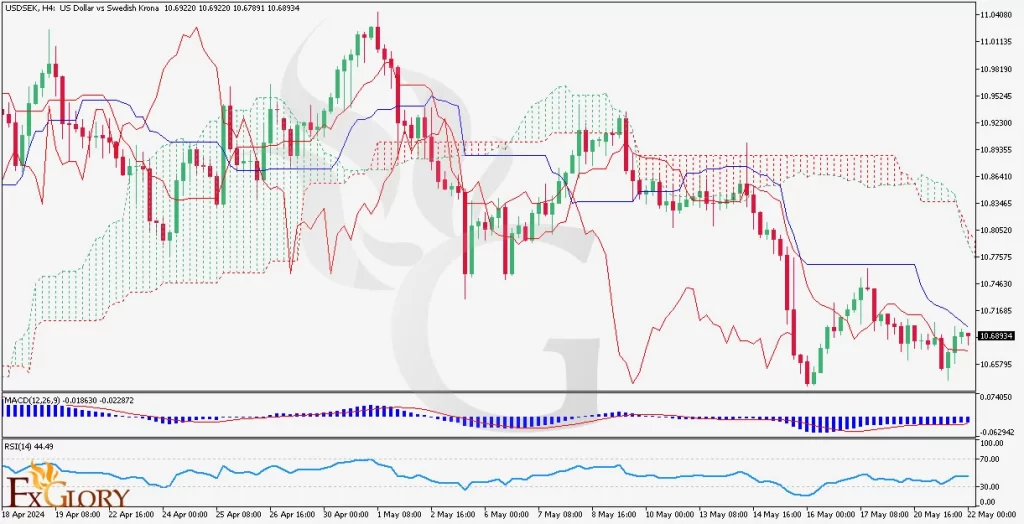
The H4 forex USD/SEK chart shows a bearish trend with the price recently touching new lows. The price action indicates a potential continuation of the downward momentum as the MACD is showing a bearish signal, suggesting that bears might maintain control of the market. Additionally, the price has recently tested the support level around 10.6800, and a break below this level could accelerate the bearish move. Conversely, a bounce from this support could provide a temporary relief rally.
Key Technical Indicators:
MACD (Moving Average Convergence Divergence):
The MACD indicator is showing a bearish crossover, indicating increasing downward momentum. This crossover suggests that the price may continue to decline as selling pressure builds.
RSI (Relative Strength Index):
The RSI is currently around the 44 level, indicating that the market is bearish but not yet oversold. This suggests there is still room for further downward movement before reaching oversold conditions.
Ichimoku Cloud:
The price is trading below the Ichimoku Cloud, indicating a bearish trend. The cloud itself is thick, suggesting strong resistance above the current price level.
Support and Resistance:
Support: The immediate support level is at 10.6800, which is a critical level to watch. A break below this level could lead to further declines.
Resistance:
The next significant resistance level to watch is around 10.7500, followed by a higher resistance at approximately 10.8000.
Conclusion and Consideration:
The USD/SEK pair on the H4 chart is showing signs of continued bearish momentum after touching recent lows. Key technical indicators, such as the MACD and RSI, suggest increasing bearish pressure, indicating potential further downside. Traders should monitor the 10.6800 support level closely, as a break below this level could confirm the bearish trend. Additionally, any economic data or statements from the Federal Reserve and Riksbank could impact the USD/SEK pair significantly. It is essential to stay informed and adjust trading strategies accordingly.
Disclaimer:
The provided analysis is for informational purposes only and does not constitute investment advice. Traders should conduct their own research and analysis before making any trading decisions.
FxGlory
22.05.2024