Time Zone: GMT +3
Time Frame: 4 Hours (H4)
Fundamental Analysis:
The USD/CAD price is influenced by various economic factors, including interest rate differentials between the Federal Reserve and the Bank of Canada, economic indicators such as GDP growth rates, and commodity prices, particularly oil, which is a major export for Canada. Today, the US has several FOMC members speaking, which might provide subtle hints about future monetary policy, potentially impacting the USD. Additionally, a bank holiday in Canada (Victoria Day) could lead to lower liquidity and increased volatility in the market.
Price Action:
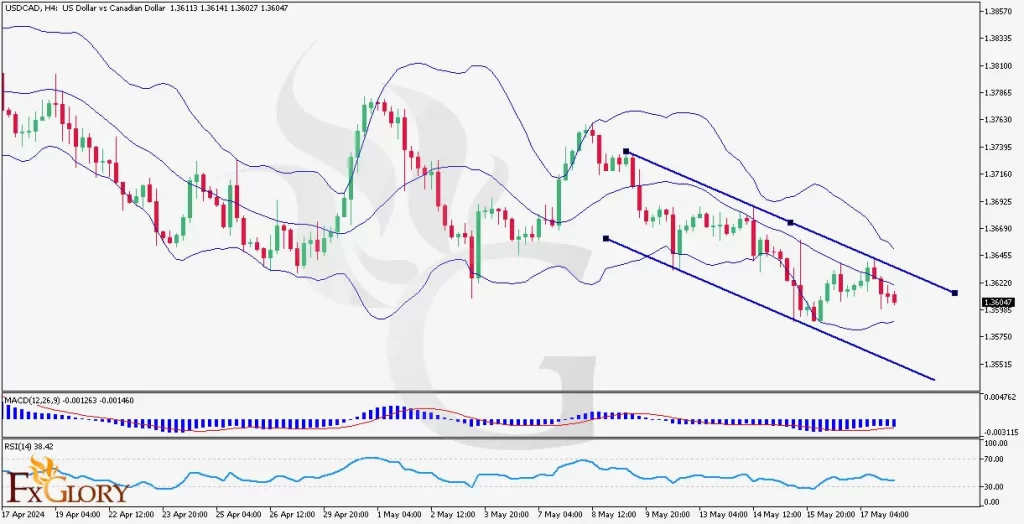
The H4 forex USDCAD chart shows a downward channel indicating a bearish USDCAD trend. The price has been consistently making lower highs and lower lows. Currently, the price is moving towards the lower boundary of the channel, suggesting continued bearish pressure. The recent USDCAD price action with four consecutive candles near the lower Bollinger Band indicates strong selling momentum.
Key Technical Indicators:
Bollinger Bands: The bands are tightening, suggesting reduced volatility. The current price is moving towards the lower band, indicating bearish momentum. This could either mean a continuation of the downtrend or a potential bounce if the lower band acts as support.
MACD (Moving Average Convergence Divergence): The MACD line is below the signal line and in negative territory, which confirms the bearish trend and suggests that downward momentum is still in play.
RSI (Relative Strength Index): The RSI is around 38.42, indicating that the market is not yet oversold, leaving room for further downside before a potential reversal or consolidation.
Support and Resistance:
Support: The immediate support level is around 1.3550, which coincides with the lower boundary of the descending channel.
Resistance: The first resistance level is at 1.3660, followed by a more significant resistance around 1.3740, which is near the upper boundary of the channel.
Conclusion and Consideration:
The USD/CAD pair forecast on the H4 chart is exhibiting a clear bearish trend within a descending channel. The key technical indicators, such as Bollinger Bands, MACD, and RSI, support this bearish outlook. Traders should watch for a break below the immediate support level of 1.3550 for further downside potential. Conversely, any hawkish comments from FOMC members today could provide some strength to the USD, leading to a potential reversal or correction. Given the low liquidity due to the Canadian bank holiday, traders should be cautious of potential volatility spikes.
Disclaimer: The provided analysis is for informational purposes only and does not constitute investment advice. Traders should conduct their own research and analysis before making any trading decisions.