Time Zone: GMT +2
Time Frame: 4 Hours (H4)
Fundamental Analysis:
The GBPAUD pair reflects the dynamics between the UK and Australian economies. The British Pound may be affected by UK economic releases, Brexit negotiations outcomes, and Bank of England’s monetary policy shifts. The Australian Dollar often responds to commodity price changes, especially iron ore and coal, as Australia is a significant exporter. Moreover, trade relations with China and the Reserve Bank of Australia’s policy decisions are pivotal. The geopolitical climate and global economic performance, including pandemic recovery efforts, also weigh in, potentially causing swings in this currency pair.
Price Action:
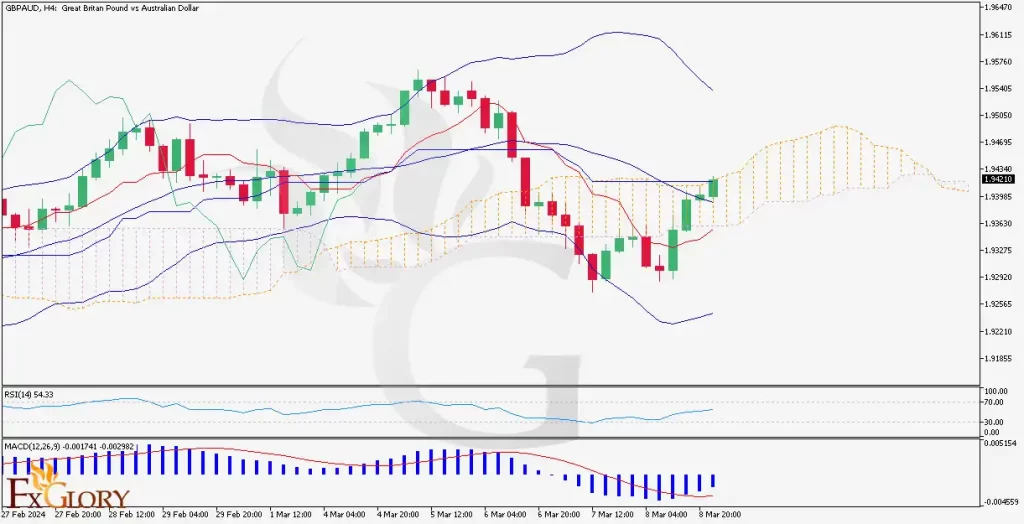
The GBPAUD H4 chart displays a recovery phase where the price action has breached the descending trend. This upward trajectory suggests a shift in market sentiment towards bullishness, with the currency pair making higher lows and higher highs. The immediate trend appears to be upward, with the price moving above the Ichimoku Cloud, indicating a potential trend continuation.
Key Technical Indicators:
Ichimoku Cloud: The price is breaking above the Ichimoku Cloud, hinting at a bullish trend with potential continuation as the cloud is projecting a support zone underneath.
RSI (Relative Strength Index): The RSI is positioned at 54.83, depicting a neutral to slightly bullish momentum, suggesting that there is room for the uptrend to continue without being overbought.
MACD (Moving Average Convergence Divergence): The MACD line is marginally above the signal line, and the histogram shows a small positive reading, indicating slight bullish momentum.
Bollinger Bands: The price is currently between the middle and upper Bollinger Bands. If it continues to move towards the upper band, it could signal a strengthening uptrend.
Support and Resistance:
Support: The middle Bollinger Band and the top of the Ichimoku Cloud may act as immediate support zones, preventing a downtrend in the short term.
Resistance: The next significant resistance could be near the upper Bollinger Band, which may coincide with previous price highs.
Conclusion and Consideration:
The H4 chart for GBPAUD suggests a bullish bias in the short term as indicated by the price action and technical indicators. Traders should consider the RSI and MACD readings that support the possibility of continued upward movement. Fundamental factors remain critical, with a need to stay updated on economic data releases from both the UK and Australia. Given the current market position, cautious optimism may be warranted, and risk management strategies should be in place to protect against unexpected volatility.
Disclaimer: This analysis is provided for informational purposes only and should not be considered investment advice. Engage in trading only after conducting thorough research and analysis, and consult a financial advisor as needed.