
AUDCAD Forecast

AUD iconCAD icon
AUD/CAD

Australian Dollar vs Canadian Dollar

AUD/CAD Live Price

0.99016
+0.00%

AUD/CAD Forecast — 14 September 2026

Time Zone: GMT +3

Time Frame: Daily (D1) / Weekly Outlook

Weekly Fundamental Overview:

The AUD/CAD currency pair reflects the ongoing balance between Australian economic performance and Canadian market dynamics. Broader market sentiment remains linked to global growth trends, commodity demand, and upcoming labor market data, which could influence expectations around interest rate paths.

Price Action:

On the daily (D1) chart, AUD/CAD recently rebounded from a daily low of 0.98975 to settle near 0.99438. The pair continues to print higher lows over recent sessions, although overhead selling pressure near previous local highs keeps price action contained below psychological levels.

Key Technical Indicators:

Bollinger Bands: The daily Bollinger Bands place the middle line at 0.99133, with an upper band at 1.00065 and a lower band at 0.98201. Trading at 0.99438, AUD/CAD remains positioned above the mid-band baseline, pointing to a mild bullish tilt within the current envelope.

RSI: The 14-period Relative Strength Index (RSI) sits at 55.79. Holding above the 50 centerline while staying below the 70 overbought threshold, the indicator reflects stable upside momentum with room for movement in either direction.

MACD: The MACD indicator on the daily timeframe registers at 0.00236. Holding in positive territory, the MACD points to persistent underlying buying interest, though momentum remains steady rather than aggressive.

Support and Resistance:

Key technical levels for AUD/CAD include immediate resistance at 0.99880, which marks a significant overhead barrier. On the downside, critical daily support is established at 0.97524.

News to Watch for AUDCAD This Week:

  • Employment Change: This indicator provides insight into labor market strength that could influence domestic interest rate expectations.
  • Unemployment Rate: The jobless rate offers crucial data on economic stability and broader employment market trends.

Weekly Outlook and Consideration:

AUD/CAD maintains a constructive outlook as it trades at 0.99438, above its daily middle Bollinger Band of 0.99133. Positive MACD momentum (0.00236) and a supportive RSI level of 55.79 suggest buyers retain control in the short term. A continued advance may target resistance at 0.99880, whereas a pullback would turn focus toward support at 0.97524 and fundamental risk drivers.

Disclaimer: The analysis provided for AUD/CAD is for informational purposes only and does not constitute investment advice. Traders are encouraged to perform their own analysis and research before making any trading decisions. Market conditions can change quickly, so staying informed with the latest data is essential.
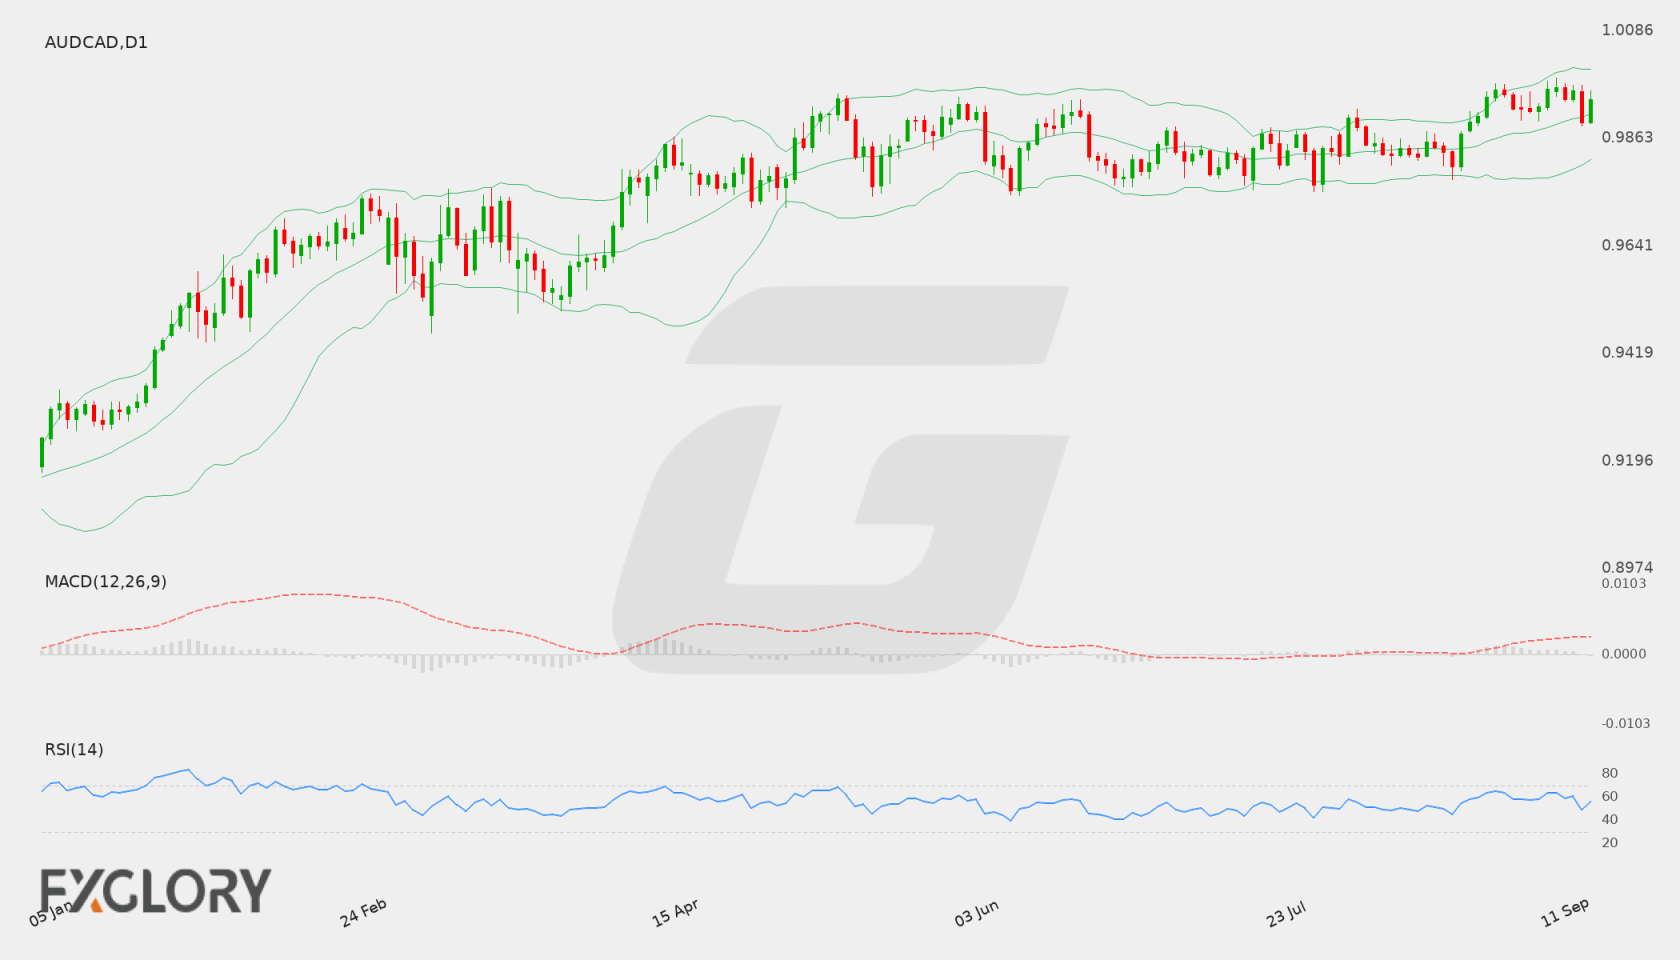
AUD/CAD D1 technical analysis chart
AUD/CAD D1 Technical Analysis for 09.14.2026

AUD/CAD Forecast — 22 August 2026

Time Zone: GMT +3

Time Frame: Daily (D1) / Weekly Outlook

Weekly Fundamental Overview:

The fundamental picture for AUD/CAD centers on key inflation metrics from Australia and monthly economic performance data from Canada. Inflation trends in Australia, including headline and underlying price readings, offer vital cues regarding domestic price pressures. Meanwhile, upcoming Canadian output figures provide insight into overall economic health. Traders monitor these releases to gauge potential shifts in economic momentum and policy perspectives for both currencies.

Price Action:

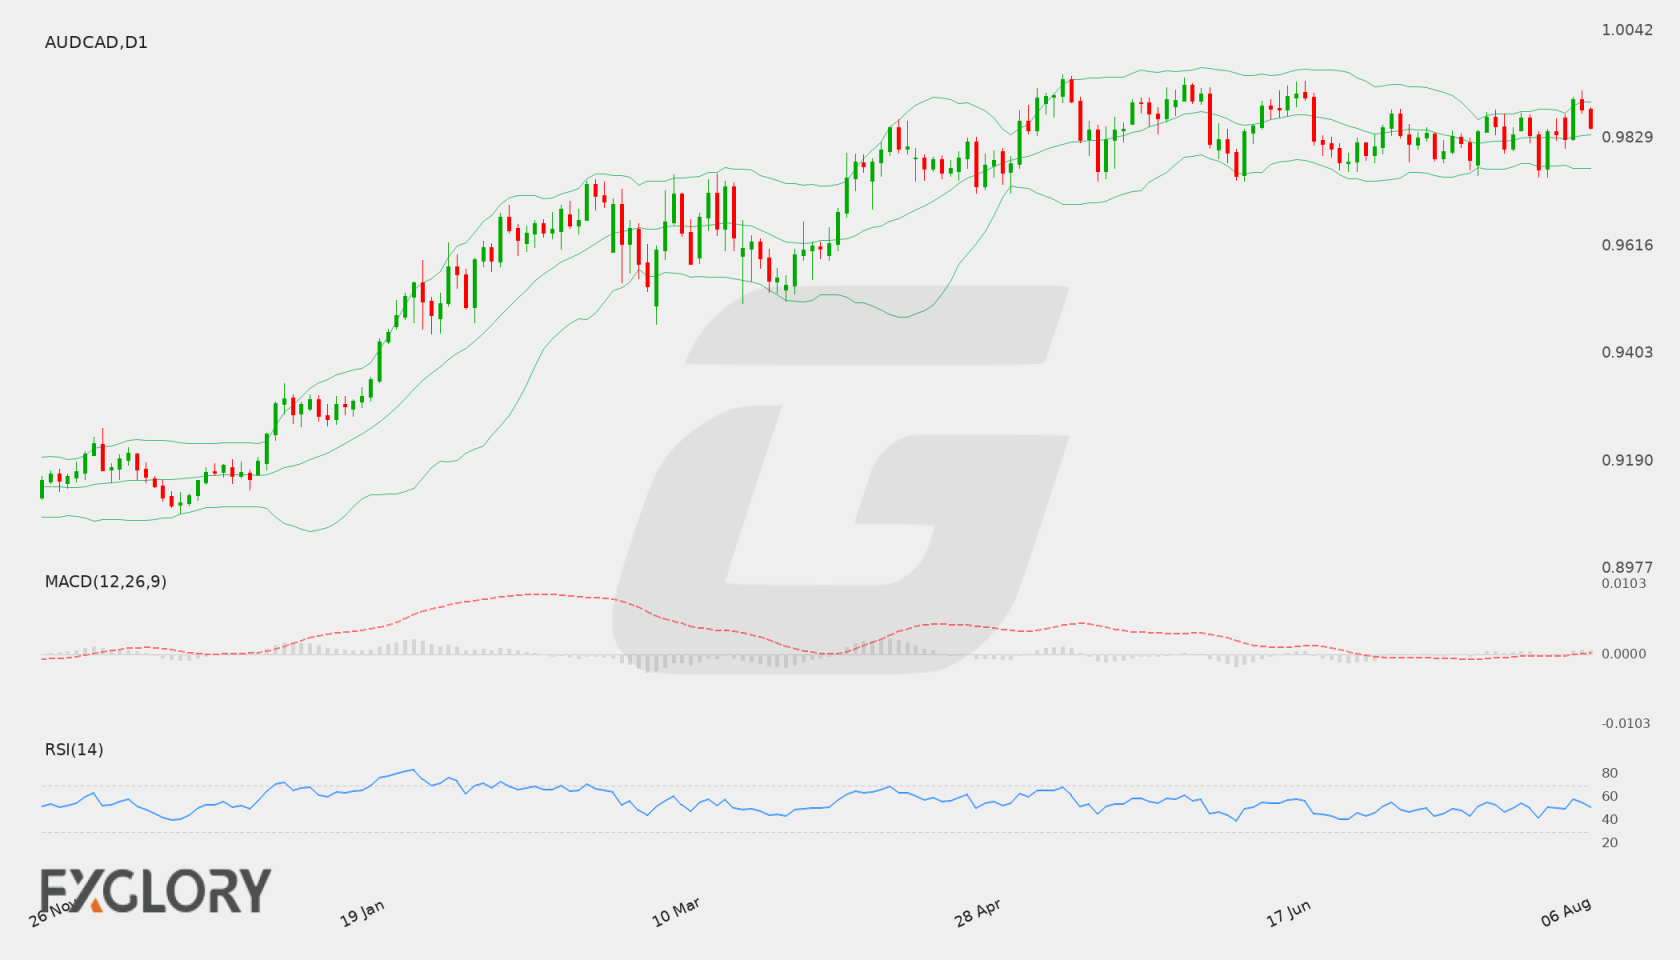
On the daily chart, AUD/CAD recently pulled back from higher levels near 0.98553 down to a close of 0.98056. The pair has demonstrated a gradual shift lower toward the middle and lower bounds of its recent range. Price action remains bounded by defined technical parameters, with recent daily sessions showing persistent downward pressure while hovering above key horizontal support.

Key Technical Indicators:

Bollinger Bands: The daily Bollinger Bands display a middle band (20-day SMA) at 0.98409, an upper band at 0.98959, and a lower band at 0.97859. With the latest close at 0.98056, AUD/CAD trades below the middle band and sits near the lower boundary, reflecting short-term weakness within the band structure.

RSI: The 14-day Relative Strength Index (RSI) is recorded at 44.73. This neutral-to-bearish reading indicates that sellers maintain a slight edge without pushing the pair into oversold conditions below the 30 threshold.

MACD: The daily MACD indicator sits slightly in negative territory at -0.00018. This negative value indicates a modest bearish momentum bias, reflecting the recent series of lower daily closes across recent trading sessions.

Support and Resistance:

Key daily technical levels for AUD/CAD include immediate support at 0.97441 and resistance at 0.99492. The instrument’s current price of 0.98056 resides between these primary technical boundaries.

News to Watch for AUDCAD This Week:

  • CPI m/m: This monthly inflation release tracks changes in consumer prices that can impact interest rate expectations.
  • Trimmed Mean CPI m/m: This core inflation measure filters out extreme price fluctuations to highlight underlying cost trends.
  • CPI y/y: The annual inflation rate provides a broader assessment of long-term price stability and purchasing power changes.
  • GDP m/m: Canadian monthly economic growth figures measure domestic output activity and overall economic performance.

Weekly Outlook and Consideration:

The daily outlook for AUD/CAD reflects a neutral to slightly bearish bias as price action holds below the 20-day simple moving average at 0.98409. With the MACD at -0.00018 and the RSI at 44.73, momentum indicators align with the recent pullbacks towards lower band levels. A push higher would face initial resistance around the upper Bollinger Band at 0.98959 prior to testing main resistance at 0.99492. Conversely, sustained downside movement may test lower Bollinger support near 0.97859 before approaching primary technical support at 0.97441. Economic data releases throughout the week could further influence direction.

Disclaimer: The analysis provided for AUD/CAD is for informational purposes only and does not constitute investment advice. Traders are encouraged to perform their own analysis and research before making any trading decisions. Market conditions can change quickly, so staying informed with the latest data is essential.
AUD/CAD Forecast — 15 August 2026

Time Zone: GMT +3

Time Frame: Daily (D1) / Weekly Outlook

Weekly Fundamental Overview:

AUD/CAD trading dynamics remain focused on upcoming economic developments in both Australia and Canada. Market participants are monitoring labor market metrics from Australia alongside key inflation figures from Canada, both of which could influence interest rate expectations and central bank policy sentiment for the AUD and CAD.

Price Action:

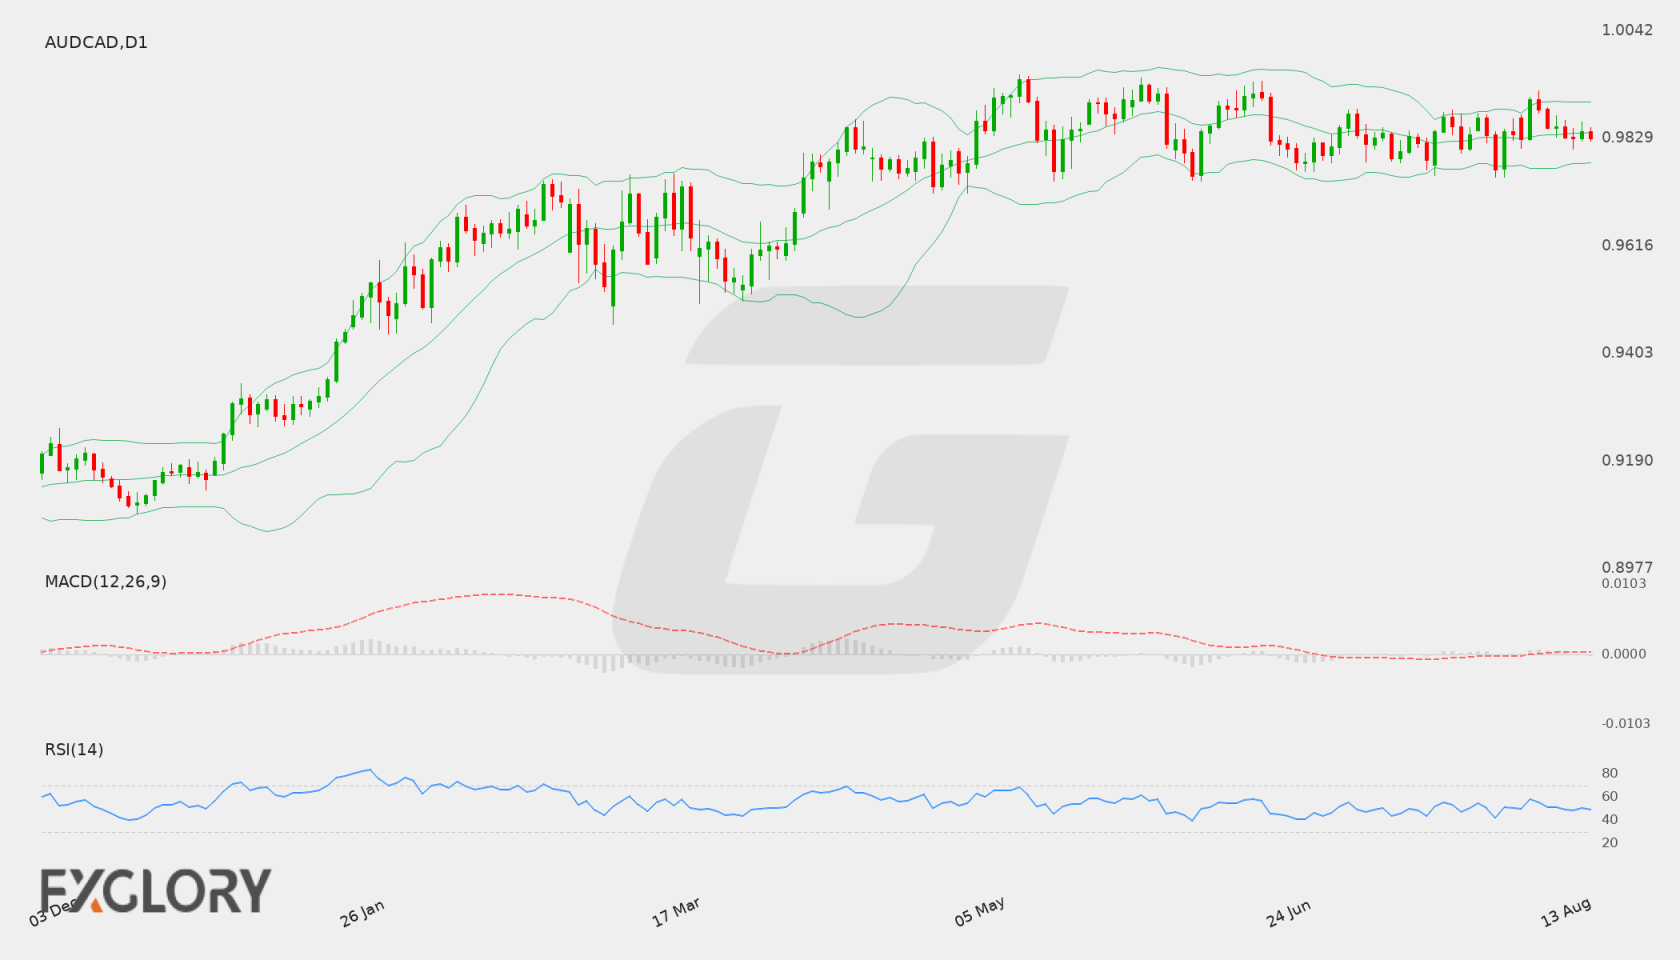
On the D1 chart, AUD/CAD closed at 0.98306 after bouncing between recent swing lows near 0.97673 and upper daily peaks near 0.99057. Price action currently reflects a period of consolidation close to the middle region of the daily range.

Key Technical Indicators:

Bollinger Bands: The D1 Bollinger Bands show a middle line at 0.98406, an upper band at 0.99013, and a lower band at 0.97800. Trading at 0.98306 places the pair near the middle band, signaling neutral short-term volatility and balanced price action.

RSI: The 14-period D1 RSI is currently reading 48.63. Positioned near the neutral 50 level, the oscillator signals neither overbought nor oversold conditions.

MACD: The D1 MACD indicator is sitting near 0.00016, holding slightly above the zero line. This indicates flat momentum without a strong directional trend in the immediate term.

Support and Resistance:

Key technical levels on the daily chart show main support at 0.97441 and key resistance at 0.99492. Intermediary boundaries include the lower Bollinger Band at 0.97800 and the upper Bollinger Band at 0.99013.

News to Watch for AUDCAD This Week:

  • Median CPI y/y: Tracks underlying Canadian inflation, potentially altering Bank of Canada policy expectations.
  • CPI m/m: Measures short-term Canadian consumer price shifts, influencing CAD sentiment.
  • Trimmed CPI y/y: Reflects core inflation trends in Canada, impacting interest rate forecasts.
  • Common CPI y/y: Evaluates key consumer price measures in Canada, affecting CAD positioning.
  • Wage Price Index q/q: Shows changes in Australian labor costs, providing guidance on inflation pressure.
  • Employment Change: Reports monthly job additions or losses in Australia, driving AUD momentum.
  • Unemployment Rate: Highlights conditions in the Australian labor market, affecting policy outlooks.

Weekly Outlook and Consideration:

AUD/CAD approaches the upcoming sessions in a range-bound state near 0.98306, positioned between primary support at 0.97441 and key resistance at 0.99492. A sustained move above the middle Bollinger Band at 0.98406 could encourage buyers toward upper resistance near 0.99013 and 0.99492. Conversely, a push below the lower Bollinger Band at 0.97800 may open the door for a retest of support around 0.97441. Macro economic releases from Australia and Canada will likely dictate directional breakouts.

Disclaimer: The analysis provided for AUD/CAD is for informational purposes only and does not constitute investment advice. Traders are encouraged to perform their own analysis and research before making any trading decisions. Market conditions can change quickly, so staying informed with the latest data is essential.
AUD/CAD D1 technical analysis chart
AUD/CAD D1 Technical Analysis for 08.15.2026

AUD/CAD Forecast — 9 August 2026

Time Zone: GMT +3

Time Frame: Daily (D1) / Weekly Outlook

Weekly Fundamental Overview:

The AUD/CAD currency pair continues to trade within a broader consolidation range, influenced by shifting sentiment surrounding commodity-linked currencies. Market participants are closely monitoring central bank communications and economic fundamentals from Australia and Canada for directional clarity.

Price Action:

On the daily D1 chart, AUD/CAD closed at 0.98507 after testing temporary high levels near 0.99057 before retracing slightly. The recent candlestick patterns indicate a balanced market where buyers and sellers are competing near key psychological levels.

Key Technical Indicators:

Bollinger Bands: The daily Bollinger Bands reveal a middle line situated at 0.98357, an upper band at 0.99018, and a lower band at 0.97696. The last close of 0.98507 positions the rate just above the middle band, indicating a mild bullish bias within the current volatility bounds.

RSI: The 14-day Relative Strength Index (RSI) stands at 51.07. Resting near the neutral midpoint of 50, the indicator suggests equilibrium between buyers and sellers without presenting overbought or oversold conditions.

MACD: The MACD indicator is currently reading 0.000716, holding slightly above the zero line. This positive value reflects moderate underlying bullish momentum, although the histogram shows moderate movement without strong divergence.

Support and Resistance:

Key technical benchmarks for AUD/CAD feature primary support located at 0.97437 and prominent resistance placed at 0.99492. A decisive move outside of this established range could dictate the next major trend.

News to Watch for AUDCAD This Week:

  • RBA Gov Bullock Speaks: Remarks from the Reserve Bank of Australia governor can provide key signals regarding interest rate expectations and economic outlook.

Weekly Outlook and Consideration:

The weekly outlook for AUD/CAD remains largely neutral with a slight upward inclination as the price rests at 0.98507 above the 0.98357 middle Bollinger Band. Neutral RSI at 51.07 and a small positive MACD of 0.000716 signal steady conditions. Price action will likely be framed by key resistance at 0.99492 and strong support at 0.97437 in the upcoming sessions.

Disclaimer: The analysis provided for AUD/CAD is for informational purposes only and does not constitute investment advice. Traders are encouraged to perform their own analysis and research before making any trading decisions. Market conditions can change quickly, so staying informed with the latest data is essential.

AUD/CAD D1 technical analysis chart
AUD/CAD D1 Technical Analysis for 08.09.2026

AUD/CAD Forecast — 2 August 2026

Time Zone: GMT +4

Time Frame: 4 Hours (H4)

Fundamental Analysis:

The economic calendar currently provides no scheduled macro releases for AUD/CAD in the dataset. Market participants are observing price technicals and market structure to evaluate near-term moves without immediate fundamental catalyst events.

Price Action:

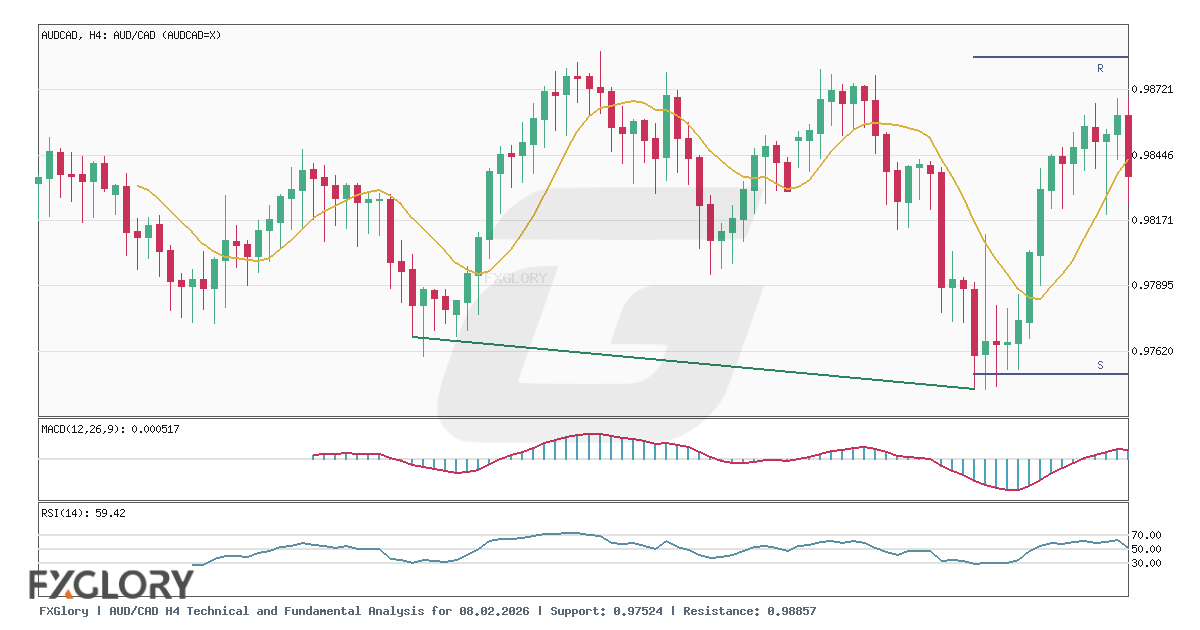
On the H4 timeframe, AUD/CAD has staged a recovery from lower price levels near 0.97629 to its recent close at 0.98538. Recent candle action shows a high of 0.98565 and a low of 0.98253 in the latest session, reflecting ongoing buying pressure following a rebound.

Key Technical Indicators:

Bollinger Bands(20,2.000): The H4 Bollinger Bands for AUD/CAD show a middle band at 0.981289, an upper band at 0.988021, and a lower band at 0.974557. Trading above the middle band positions the price in the upper half of the envelope towards resistance.

MACD(12,26,9): The MACD indicator for AUD/CAD sits at a positive value of 0.000517 on the H4 chart, signaling mild bullish momentum in recent sessions.

RSI(14): The 14-period RSI for AUD/CAD registers at 59.42 on the H4 timeframe, pointing to neutral-to-positive momentum while remaining below overbought territory.

Support and Resistance:

Immediate key technical levels for AUD/CAD are established at resistance of 0.98857 and support of 0.97524, which outline the major range boundaries for current trading structure.

Conclusion and Consideration:

AUD/CAD continues to show short-term upward momentum on the H4 chart, trading at 0.98538 above the middle Bollinger Band of 0.981289. With RSI at 59.42 and MACD at 0.000517, price action remains framed between key support at 0.97524 and key resistance at 0.98857.

Disclaimer: The analysis provided for AUD/CAD is for informational purposes only and does not constitute investment advice. Traders are encouraged to perform their own analysis and research before making any trading decisions. Market conditions can change quickly, so staying informed with the latest data is essential.

AUD/CAD H4 technical and fundamental analysis
AUD/CAD H4 Technical and Fundamental Analysis for 08.02.2026
1AUD = –––CAD –––%
AUDCAD
Loading chart...