USD/CHF Forecast — 25 May 2026
Time Zone: GMT +3
Time Frame: 4 Hours (H4)
Fundamental Analysis:
The USDCHF H4 technical and fundamental analysis is expected to experience irregular volatility today as both US and Swiss banks remain closed due to Memorial Day in the United States and Whit Monday in Switzerland. Reduced institutional participation and lower liquidity conditions may lead to unpredictable price swings and sharper short-term volatility in the forex market. Since banks facilitate a significant portion of foreign exchange transactions, reduced market depth could amplify speculative movements in the USDCHF H4 price action. Although no major economic releases are scheduled, traders should remain cautious as thin liquidity environments often create false breakouts and sudden reversals. Overall, the current USDCHF daily analysis and forex forecast suggests that technical levels may play a more dominant role than fundamentals during today’s trading session.
Price Action:
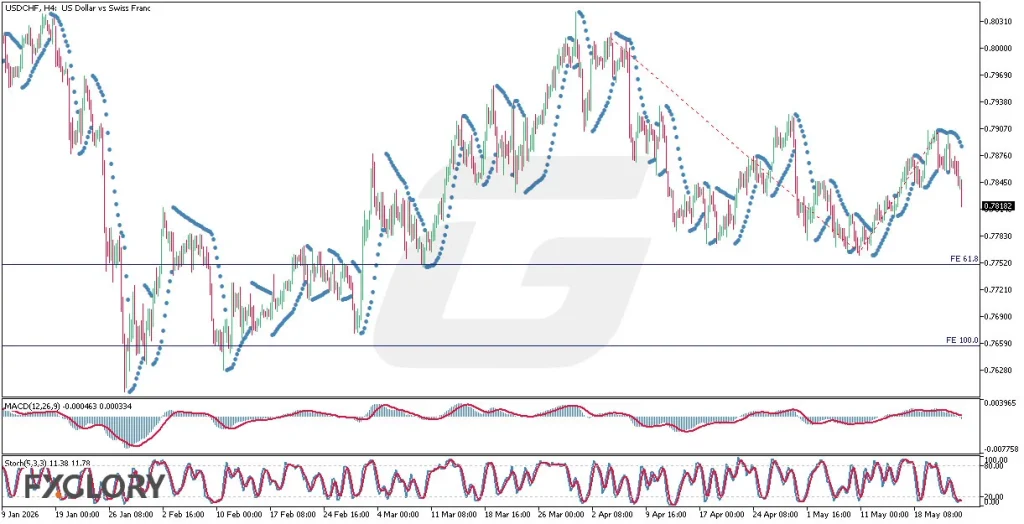
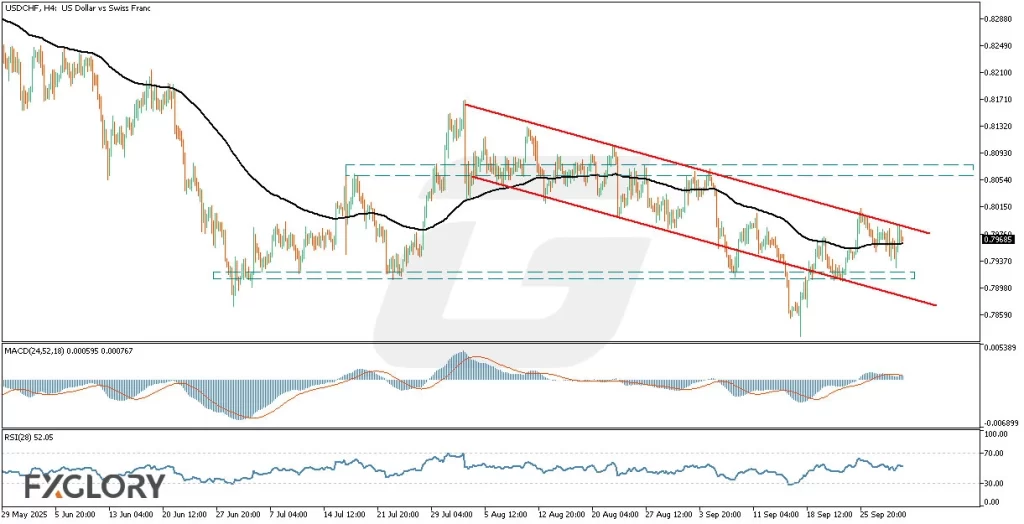
The USDCHF H4 price action analysis shows that the pair has been declining sharply during bearish waves while bullish corrections have developed at a much slower pace, creating a broader mild bearish structure. Recently, the candles completed another gradual corrective recovery before beginning to turn lower once again, signaling renewed bearish pressure in the market. Based on the Fibonacci Expansion structure visible on the chart, the candles may now attempt to revisit the 61.8 Fibonacci level near 0.77520, where previous reactions and temporary stabilization occurred. If the market reaches this support zone again, traders may expect another consolidation or corrective rebound phase to develop. The overall USDCHF H4 chart analysis therefore continues favoring bearish continuation unless stronger bullish momentum unexpectedly returns.
Key Technical Indicators:
Parabolic SAR: The Parabolic SAR dots are currently positioned above the candles, confirming that bearish momentum remains dominant in the short-term trend structure. This indicator continues supporting the possibility of additional downside movement toward lower support areas.
MACD (12,26,9): The MACD currently stands at -0.000463 and 0.000334, reflecting weakening bullish momentum and the gradual return of bearish pressure. The histogram also shows fading upward momentum, suggesting that sellers are slowly regaining control of the market.
Stochastic (5,3,3): The Stochastic oscillator readings at 11.38 and 11.78 indicate that the market is approaching oversold territory. While this could eventually support a short-term corrective bounce, the current momentum still favors bearish continuation in the ongoing USDCHF H4 technical analysis.
Support and Resistance:
Support: The nearest support level is located around 0.77520, corresponding with the Fibonacci Expansion 61.8 level where the market recently reacted.
Resistance: The immediate resistance zone appears near 0.78182, followed by a stronger resistance area around 0.79070, where previous bearish reversals intensified.
Conclusion and Consideration:
The current USDCHF H4 technical analysis and price action forecast reflects a market that continues maintaining a mild bearish structure despite intermittent bullish corrections. Technical indicators including the Parabolic SAR, MACD, and Stochastic oscillator continue supporting downside pressure, with the pair potentially targeting the Fibonacci 61.8 support level in the near term. However, since both US and Swiss banks are closed today, traders should remain cautious of irregular volatility and reduced liquidity conditions that may create unstable market behavior. As long as the pair remains below major resistance zones, bearish continuation scenarios may continue dominating the broader USDCHF forex market outlook.
Disclaimer: The analysis provided for USD/CHF is for informational purposes only and does not constitute investment advice. Traders are encouraged to perform their own analysis and research before making any trading decisions on USDCHF. Market conditions can change quickly, so staying informed with the latest data is essential.