Time Zone: GMT+3
Time Frame: 4 Hours (H4)
Fundamental Analysis:
The BTCUSD pair, which tracks the price of Bitcoin (BTC) against the US Dollar (USD), remains highly sensitive to both macroeconomic indicators and regulatory developments. Today, attention is focused on the US Non-Farm Payrolls (NFP), Unemployment Rate, and Average Hourly Earnings—key data points that impact USD strength and overall market sentiment. Additionally, several speeches from Federal Reserve officials, including Chair Jerome Powell, may trigger volatility if they provide clues about future monetary tightening or rate hikes. Strong job data and hawkish Fed tone could pressure Bitcoin, while dovish sentiment or weak employment numbers may support BTC. The market is bracing for sharp movements on the BTC/USD H4 chart, as traders react to this critical news.
Price Action:
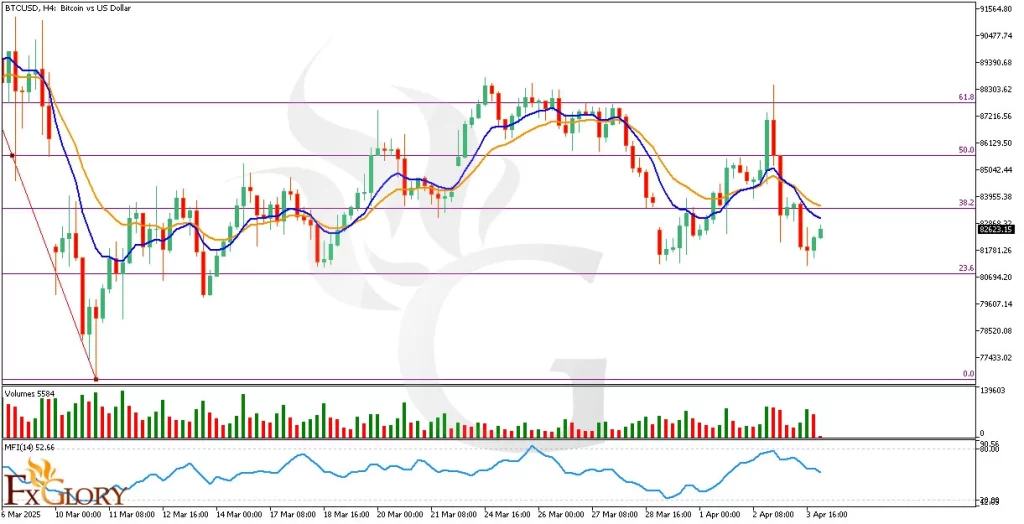
The BTCUSD H4 chart shows that price recently pulled back after a local top near the 61.8% Fibonacci retracement level, indicating resistance. A bearish wave followed, pushing the price below the 50% and 38.2% Fibonacci levels. However, the last two candles show signs of bullish correction, with buyers attempting to regain control. Currently, BTC is moving upward from near the 23.6% Fib zone, with potential to retest the 38.2% level, which now acts as strong resistance. If BTC breaks above it with volume support, the next key resistance lies around the 61.8% Fib level. On the downside, failure to hold above 23.6% could expose the pair to deeper drops toward the March lows.
Key Technical Indicators:
Moving Averages (MA): The chart uses a short-term MA 9 (blue) and a longer MA 17 (orange). The short MA has recently crossed below the long MA, indicating a bearish crossover. Both lines are currently close together, signaling a potential trend shift or indecision. Price action is trying to climb above both MAs, which may hint at a short-term bullish recovery if sustained.
Volume: The volume indicator shows declining selling pressure and increasing interest in recent bullish candles. This suggests that buyers may be gradually stepping in after the recent dip, but confirmation is needed with a strong breakout.
Money Flow Index (MFI): Currently at 52.56, the MFI is in a neutral zone, indicating neither overbought nor oversold conditions. The slight upward curve suggests that capital is starting to flow back into BTC, supporting the recent bullish correction in price action.
Support and Resistance:
Support: The nearest support is located around the 23.6% Fibonacci level, near 81,781, which held during the recent dip and is critical for maintaining bullish momentum.
Resistance: The immediate resistance is at the 38.2% Fibonacci level, near 83,955, which must be cleared for further upside toward the 50% and 61.8% retracement zones.
Conclusion and Consideration:
The BTC USD H4 technical and fundamental analysis suggests the market is in a short-term recovery phase, with key resistance ahead. A bullish break above the 38.2% Fibonacci level could open the door for a move toward 86,000–88,000, while failure to hold support at 23.6% may lead to further decline. Traders should watch today’s USD news releases and Fed speeches closely, as they may heavily influence risk sentiment and USD volatility, ultimately impacting BTC’s direction.
Disclaimer: The analysis provided for BTC/USD is for informational purposes only and does not constitute investment advice. Traders are encouraged to perform their own analysis and research before making any trading decisions on BTCUSD. Market conditions can change quickly, so staying informed with the latest data is essential.


