Time Zone: GMT +3
Time Frame: 4 Hours (H4)
Fundamental Analysis:
The EURNZD pair reflects the exchange rate between the Euro and the New Zealand Dollar. Recent economic data from New Zealand shows the PPI Input at 0.7%, slightly above the forecast of 0.6%, and PPI Output at 0.9%, significantly above the forecast of 0.5%. These figures indicate stronger-than-expected producer prices, supporting the NZD currency. For the Euro currency, the Final Core CPI y/y is forecasted at 2.7% and the Final CPI y/y at 2.4%, reflecting mild inflationary pressures. While these figures suggest a stable economic environment in the Eurozone, their impact is expected to be low due to the nature of these data releases.
Price Action:
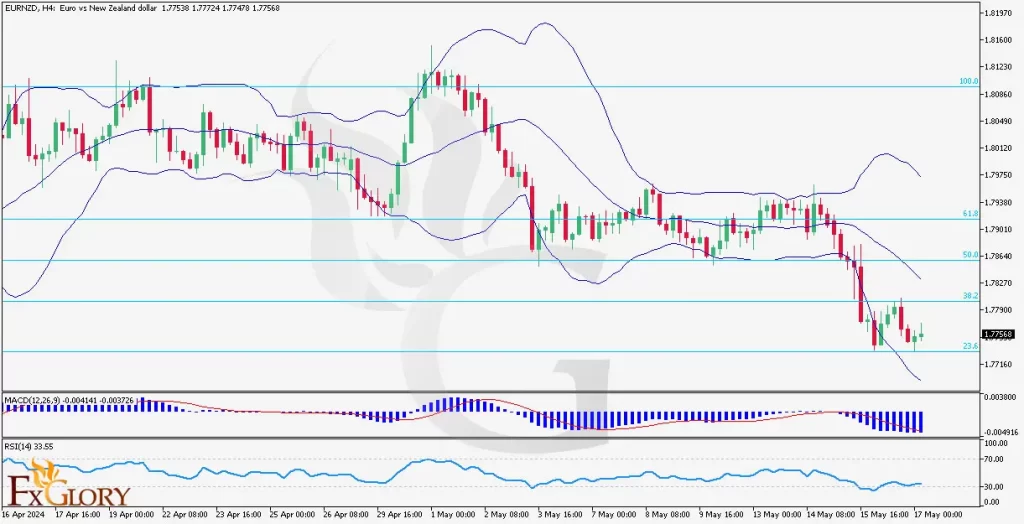
In the EURNZD technical analysis on H4 time frame, the EUR-NZD chart shows a clear downtrend, characterized by successive lower highs and lower lows. The price is currently consolidating near a recent low, suggesting potential for either a continued downward move or a short-term rebound. The bearish candles indicate strong selling pressure, and a break below the current support level could signal further declines.
Key Technical Indicators:
Bollinger Bands: The Bollinger Bands have widened and continue to widen, indicating increased volatility. The price is currently near the lower band, which suggests potential oversold conditions and a possible bounce.
MACD: The MACD line is below the signal line and in negative territory, indicating bearish momentum. The histogram shows increasing bearish divergence, suggesting that the downtrend may continue.
RSI: The RSI is at 33.55, which is approaching the oversold zone. This indicates that the pair might be due for a short-term correction or consolidation before continuing its downtrend.
Support and Resistance:
Support: The immediate support level is at 1.7748, which is a recent low. A break below this level could lead to further declines towards 1.7700.
Resistance: The immediate resistance level is at 1.7864 (23.6% Fibonacci retracement level). The next significant resistance is at 1.7900 (38.2% Fibonacci retracement level).
Conclusion and Consideration:
The EURNZD chart analysis shows a strong bearish trend on the H4 chart, as indicated by the widening Bollinger Bands and the bearish MACD signal. While the RSI suggests the pair is approaching oversold conditions, the overall EURNZD technical outlook remains bearish. Traders should monitor the support level at 1.7748 closely; a break below this level could signal further declines. Conversely, if the pair bounces, the resistance levels at 1.7864 and 1.7900 should be watched for potential selling opportunities. Given the current market conditions and economic data, traders should exercise caution and implement proper risk management strategies.
Disclaimer: The provided analysis is for informational purposes only and does not constitute investment advice. Traders should conduct their own research and analysis before making any trading decisions.