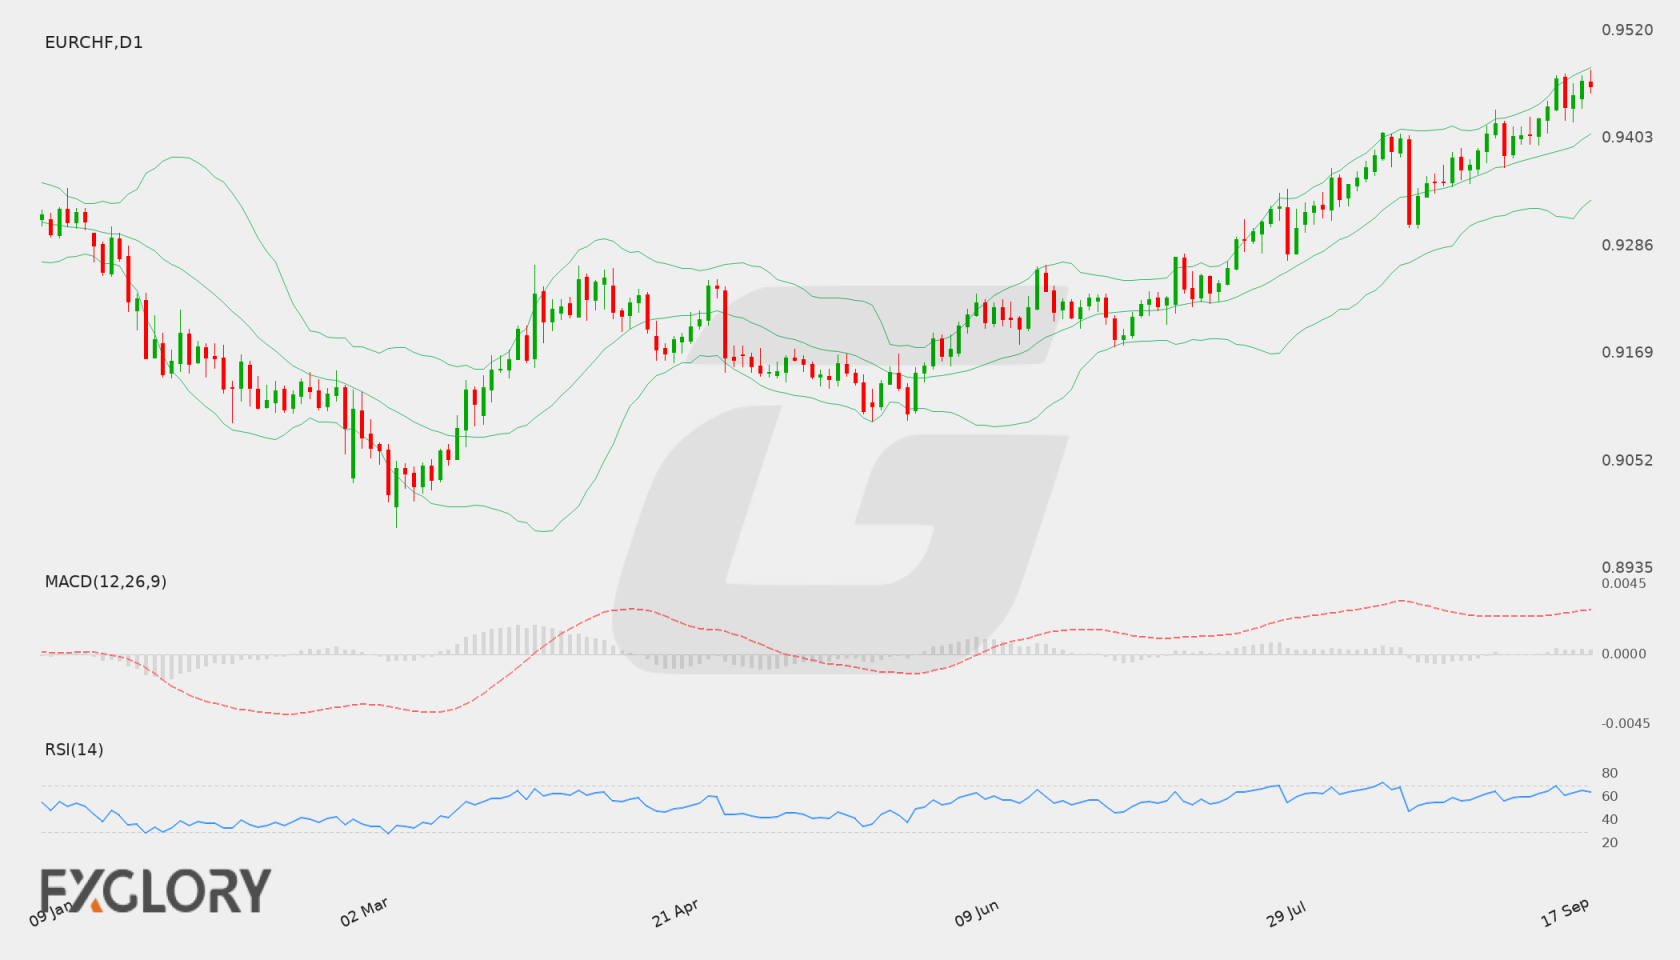
Current weekly forecast: This outlook covers 17–24 October 2026 and remains valid until 24 October 2026, unless its stated invalidation condition is triggered earlier.
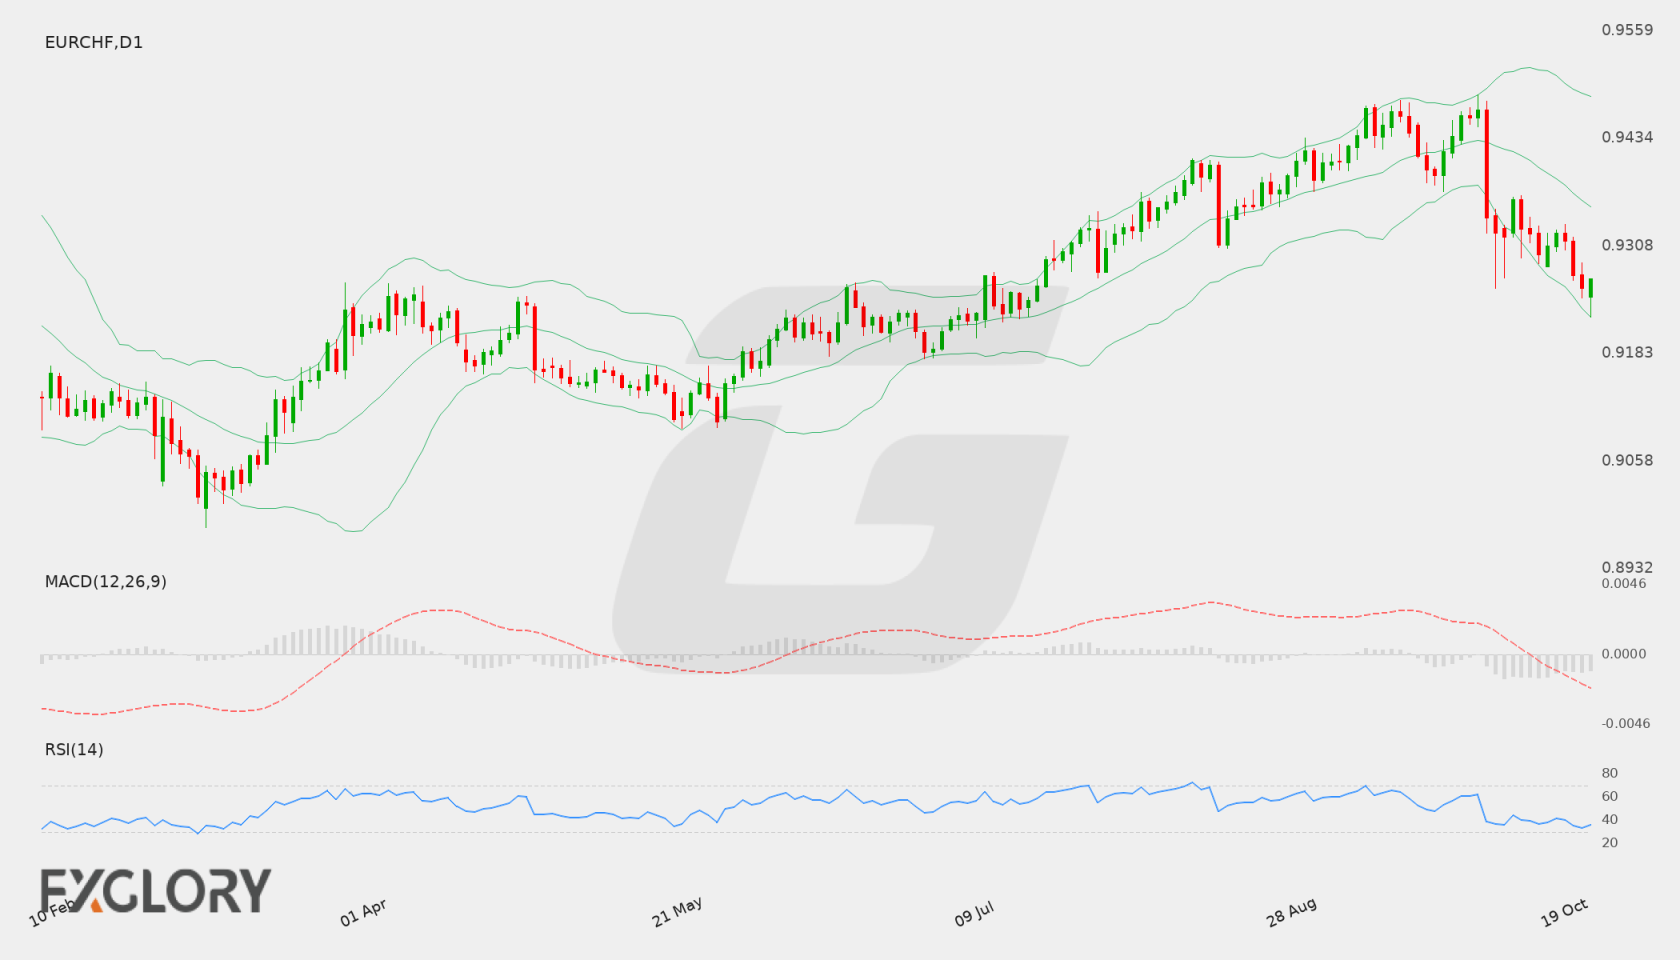
Daily check — 20 October 2026: The latest completed D1 close was 0.92700 on 19 October 2026. It remains between the formal invalidation levels 0.92246 and 0.93281. The authored weekly thesis remains valid.
In brief
EUR/CHF has a neutral weekly bias as mixed D1 structure meets negative momentum and bearish H4 pressure, keeping 0.92494 and 0.93144 central to the range framework.
The D1 close at 0.92746 sits between primary support at 0.92494 and primary resistance at 0.93144, consistent with a neutral structural reading. Negative momentum and a falling EMA50 slope lean against upside follow-through, while the rising SMA200 slope provides a longer-term counterweight.
H4 adds tactical downside pressure, with bearish classification and negative momentum, but its role remains confirmatory rather than decisive for the weekly view. A move through the established levels could clarify the next directional scenario, while stable volatility leaves room for either consolidation or a measured level test.
EUR/CHF D1 technical-analysis context for the weekly forecast. Chart data captured 20 October 2026.
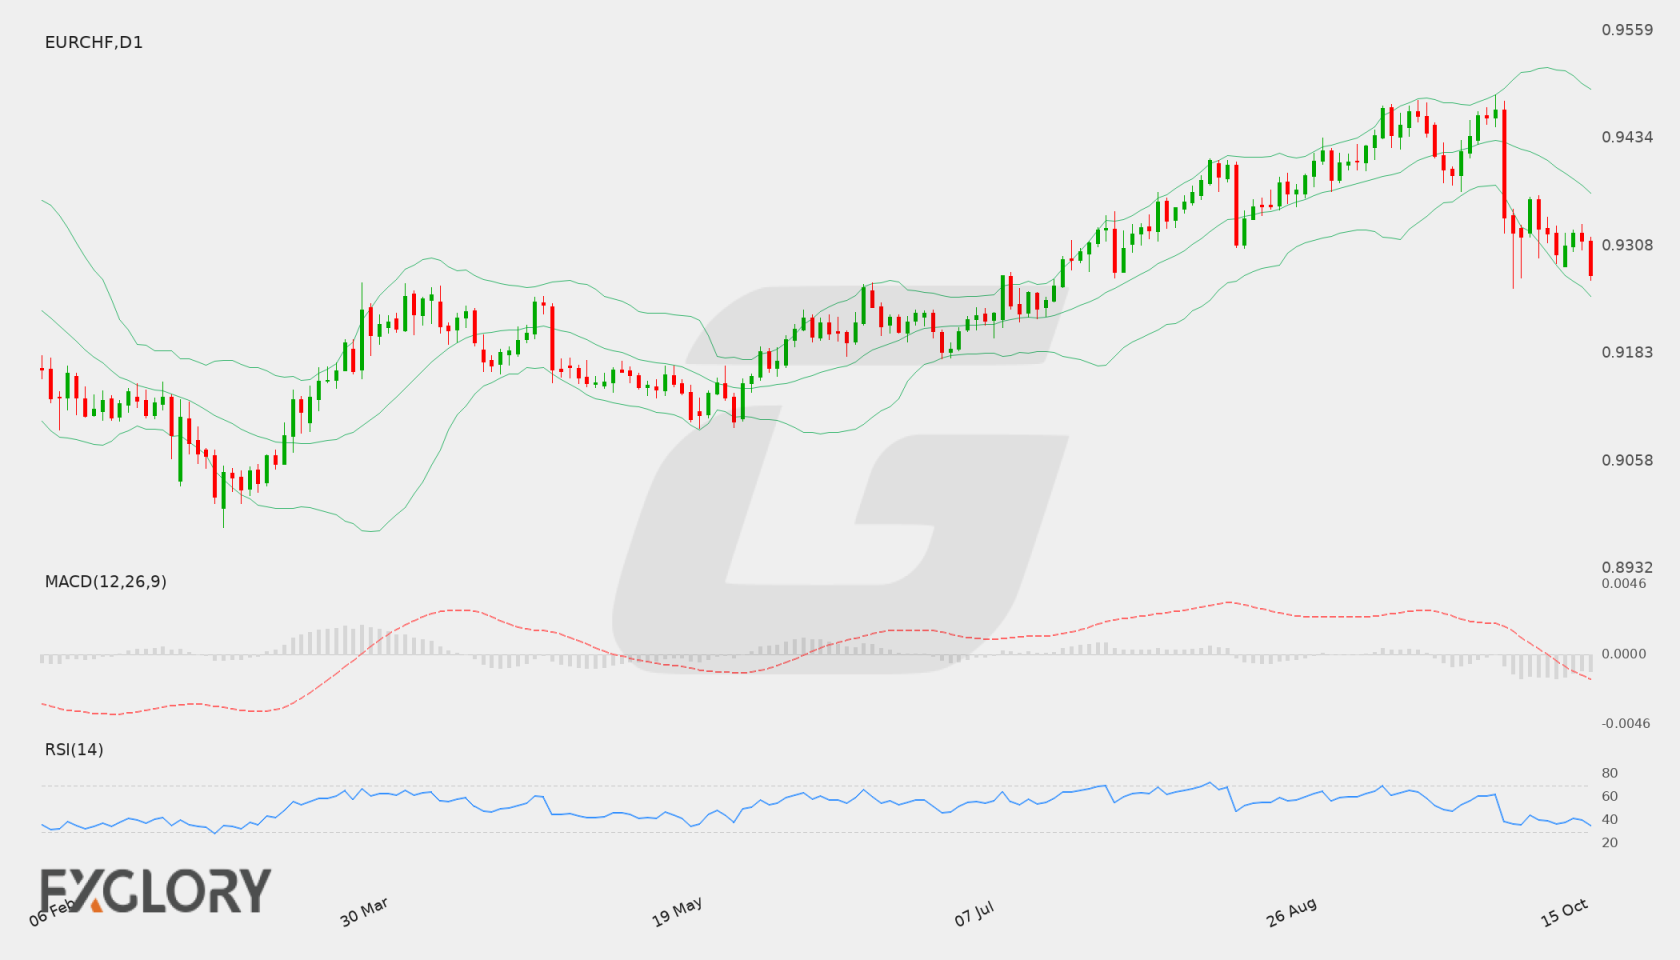
EUR/CHF has a neutral weekly outlook: mixed D1 structure is pressured by negative momentum and bearish H4 conditions, with 0.92705 support and 0.93479 resistance framing the immediate technical context.
The D1 classification remains neutral and the close sequence is mixed, so the weekly structure does not establish a clear directional lead. Negative MACD momentum and an RSI of 36.35 lean toward downside pressure, while price remains above the rising SMA200 at 0.92382; the falling EMA50 and price below both short-term averages temper that longer-average support.
H4 is bearish tactically, but its latest close at 0.93147 sits between the listed H4 support at 0.93121 and resistance at 0.93253, with a near-flat positive MACD histogram offering limited counterevidence. A completed-D1-close move beyond the formal boundaries would change the thesis framing; until then, the technical evidence supports two-sided risk rather than a settled weekly direction.
EUR/CHF D1 technical-analysis context for the weekly forecast. Chart data captured 16 October 2026.
EUR/CHF continues to reflect the balance between Eurozone economic performance and the traditional safe-haven status of the Swiss Franc. In the absence of scheduled economic calendar data, currency flows are likely to be influenced by broader market risk sentiment and shifting monetary policy expectations between the European Central Bank and the Swiss National Bank.
Price Action:
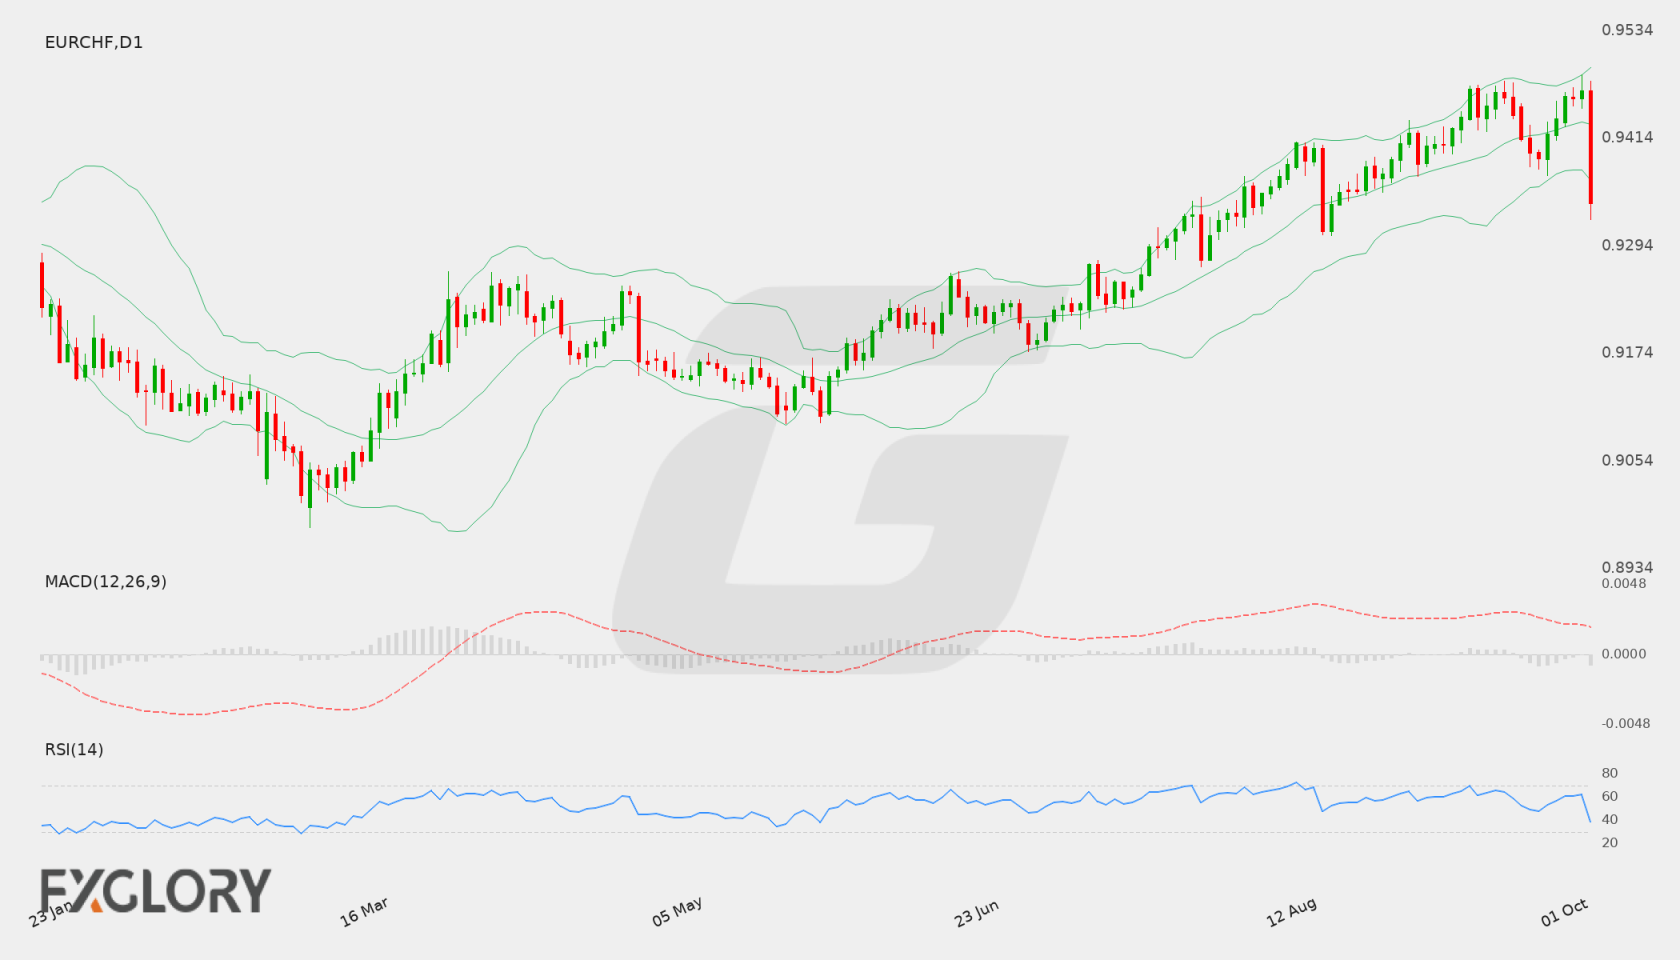
On the daily chart, EUR/CHF experienced a significant bearish drop, falling from the 0.94667 area down to a close of 0.93415 after touching an intraday low of 0.93227. This sharp downturn broke through recent consolidation ranges, shifting near-term momentum heavily to the downside.
Key Technical Indicators:
Bollinger Bands: The Bollinger Bands display a middle band at 0.94293, an upper band at 0.94923, and a lower band at 0.93663. The latest close at 0.93415 settled beneath the lower band, reflecting an oversold extension and heightened volatility to the downside.
RSI: The 14-day Relative Strength Index (RSI) stands at 38.71, sloping downward well below the 50 neutral mark. This level indicates growing bearish pressure while approaching oversold territory.
MACD: The daily MACD indicator registers at 0.00106. Although the reading remains slightly above the zero mark, recent downward price velocity threatens to erode bullish momentum if negative price pressure persists.
Support and Resistance:
Immediate resistance is located at the recent peak of 0.94847, while key technical support is identified at 0.92009. Intermediate technical barriers include the Bollinger middle band near 0.94293 on any attempted recovery.
News to Watch for EURCHF This Week:
No specific calendar events are available; market participants should monitor generic high-impact releases, central bank comments, and broader risk sentiment.
Weekly Outlook and Consideration:
EUR/CHF enters the week under technical pressure following a drop to 0.93415, placing the pair below its lower Bollinger Band at 0.93663. With RSI at 38.71 pointing downward and MACD at 0.00106 softening, sellers currently hold the upper hand. If downward momentum continues, the pair may gravitate toward the primary support at 0.92009. Conversely, any rebound would first need to recapture the lower band and push toward the 0.94293 middle band before challenging critical resistance at 0.94847.
Disclaimer: The analysis provided for EUR/CHF is for informational purposes only and does not constitute investment advice. Traders are encouraged to perform their own analysis and research before making any trading decisions. Market conditions can change quickly, so staying informed with the latest data is essential.
The EUR/CHF currency pair reflects market sentiment across the Eurozone and Switzerland. EURCHF movements remain influenced by macroeconomic developments in Europe, shifting central bank interest rate expectations, and global risk appetite affecting safe-haven assets.
Price Action:
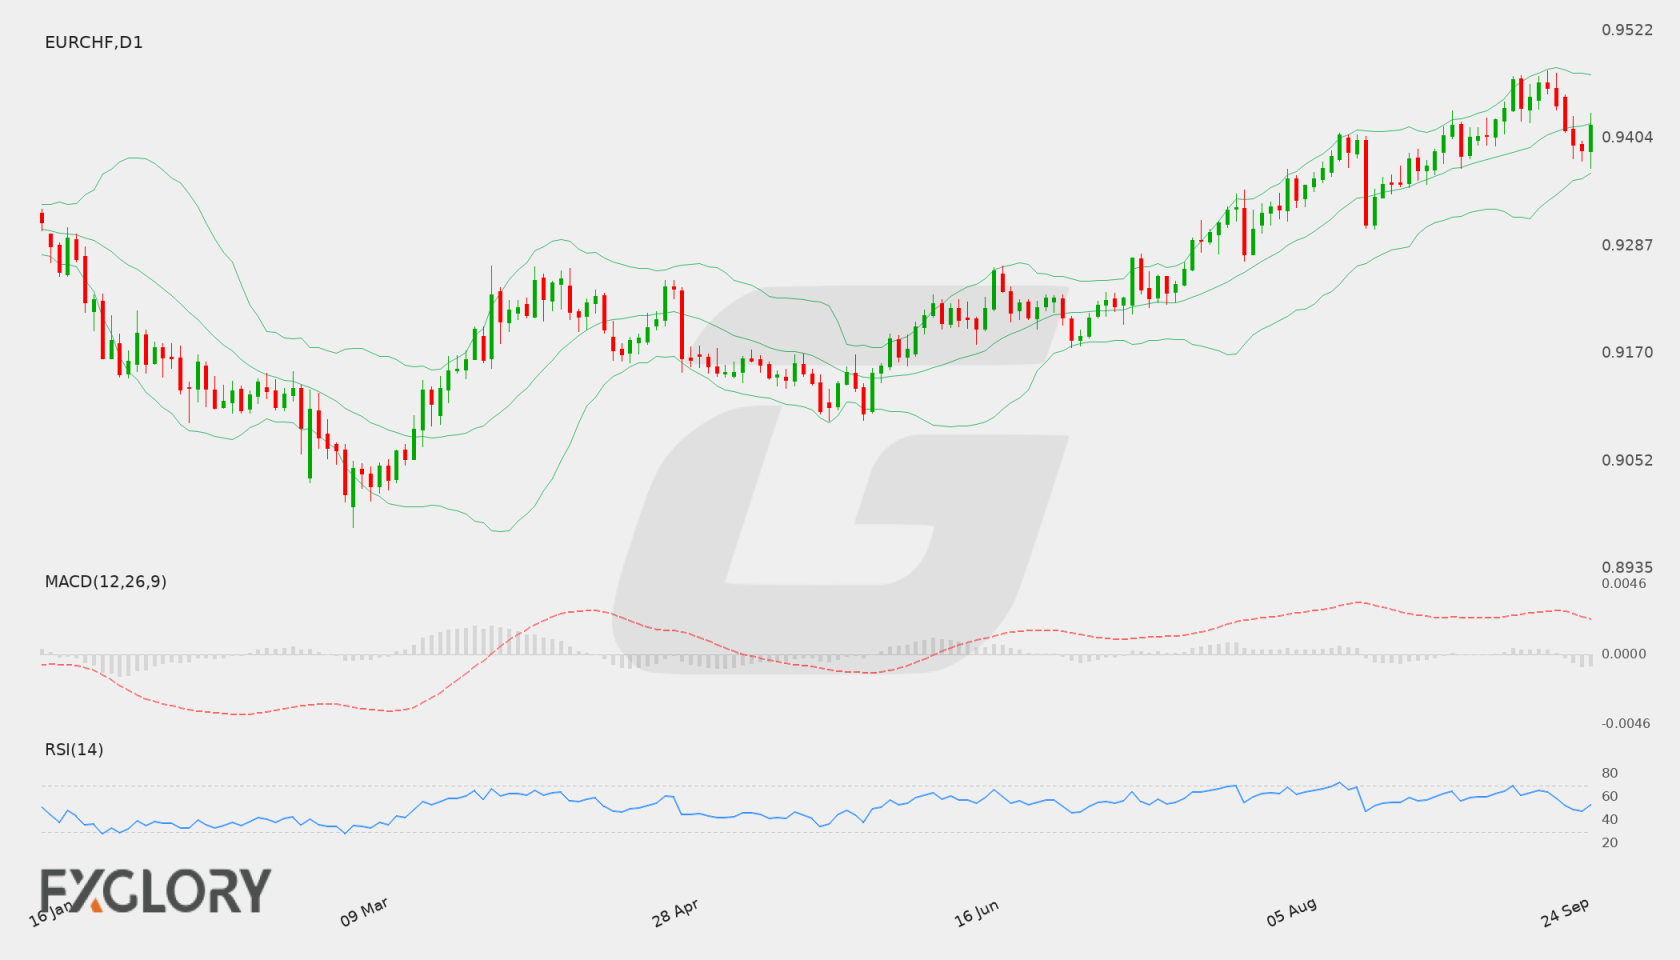
On the daily (D1) chart, EUR/CHF recently pulled back from highs near 0.9468 to a low of 0.9371 before recovering to close at 0.94185. The recent bullish candle off the lower swing zone shows buyers stepping in, keeping price action consolidated near mid-range levels.
Key Technical Indicators:
Bollinger Bands: The daily Bollinger Bands place the middle band at 0.9420, the upper band at 0.9473, and the lower band at 0.9367. EURCHF is currently oscillating around the middle band, signaling a period of consolidation after testing upper boundary levels.
RSI: The 14-day Relative Strength Index (RSI) is currently reading 53.37. Hovering just above the neutral 50 threshold, it reflects balanced market conditions with a modest bullish tilt.
MACD: The MACD indicator on the D1 timeframe remains above zero with a value of 0.001543. This positive posture indicates that broader upside momentum persists despite the recent short-term pullbacks.
Support and Resistance:
Technical analysis highlights key resistance for EURCHF at 0.94777, which aligns closely with recent local peaks. On the downside, primary structural support sits at 0.91779, with intermediate dynamic support provided by the lower Bollinger Band around 0.93667.
News to Watch for EURCHF This Week:
German Prelim CPI m/m: Measures monthly changes in German consumer prices, offering insight into Eurozone inflation trends that can influence European Central Bank policy and impact the Euro.
Weekly Outlook and Consideration:
EUR/CHF enters the week in a neutral-to-slightly constructive technical posture on the daily timeframe. A sustained push above the 0.9420 middle Bollinger Band could allow buyers to retest upper resistance near 0.94777. However, if selling pressure resumes and breaks below the 0.93667 lower band, price could drift deeper toward key support at 0.91779.
Disclaimer: The analysis provided for EUR/CHF is for informational purposes only and does not constitute investment advice. Traders are encouraged to perform their own analysis and research before making any trading decisions. Market conditions can change quickly, so staying informed with the latest data is essential.
The EUR/CHF pair is influenced by diverging macroeconomic conditions between the Eurozone and Switzerland. Traders closely monitor European Central Bank policy cues and Swiss National Bank rate sentiment, alongside overall market risk appetite. Shifts in inflation readings across Germany and the broader Eurozone, combined with Swiss price metrics, shape fundamental expectations for EUR/CHF.
Price Action:
On the daily (D1) chart, EUR/CHF has shown steady upward momentum, advancing from recent lower swings to a recent close of 0.9460. The pair is approaching overhead technical barriers, with price action holding near recent session highs and maintaining a series of higher closes.
Key Technical Indicators:
Bollinger Bands: The D1 Bollinger Bands show EUR/CHF trading near the upper band at 0.9480, demonstrating bullish pressure. The middle band (20-day simple moving average) lies at 0.9408, while the lower band is located at 0.9335, providing a clear volatility range for the daily timeframe.
RSI: The 14-day Relative Strength Index (RSI) currently sits at 64.02. This reading indicates constructive momentum favoring buyers while remaining below formal overbought thresholds, leaving potential scope for further upward movement.
MACD: The daily MACD indicator registers a positive value of 0.0031. The momentum histogram and signal lines sit above the zero mark, reflecting ongoing upside bias for the EUR/CHF pair on the daily chart.
Support and Resistance:
Immediate resistance for EUR/CHF is identified at 0.94777, situated near the upper Bollinger Band limit. Key daily support is defined at 0.91762, with secondary intermediate support available around the middle Bollinger Band level of 0.94077.
News to Watch for EURCHF This Week:
German Prelim CPI m/m: Tracks preliminary consumer price changes in Germany, which could shift European Central Bank interest rate expectations and impact the Euro.
CPI m/m: Measures monthly Swiss consumer price inflation, offering insight into Swiss National Bank policy direction and Swiss Franc demand.
CPI Flash Estimate y/y: Evaluates broader Eurozone annual inflation trends, providing key guidance for Euro exchange rate direction.
Weekly Outlook and Consideration:
EUR/CHF carries a firm stance on the daily chart following its advance to 0.9460. Trading near the upper Bollinger Band at 0.9480 and backed by an RSI of 64.02, price action points to potential testing of resistance at 0.94777. If buyers clear this level, extended bullish momentum could follow. Conversely, if momentum falters, EUR/CHF may experience a consolidation retreat toward the middle Bollinger Band at 0.9408, with main long-term support sitting at 0.91762.
Disclaimer: The analysis provided for EUR/CHF is for informational purposes only and does not constitute investment advice. Traders are encouraged to perform their own analysis and research before making any trading decisions. Market conditions can change quickly, so staying informed with the latest data is essential.