Time Zone: GMT +2
Time Frame: 4 Hours (H4)
Fundamental Analysis:
Platinum’s price is largely influenced by supply-demand dynamics, industrial usage, especially in automotive catalytic converters, and investment demand. It’s important to consider the industrial health and economic indicators such as automobile sales, manufacturing data, and investment trends which can drive platinum prices. Additionally, mining supply disruptions or changes in recycling volumes can impact the market significantly.
Price Action:
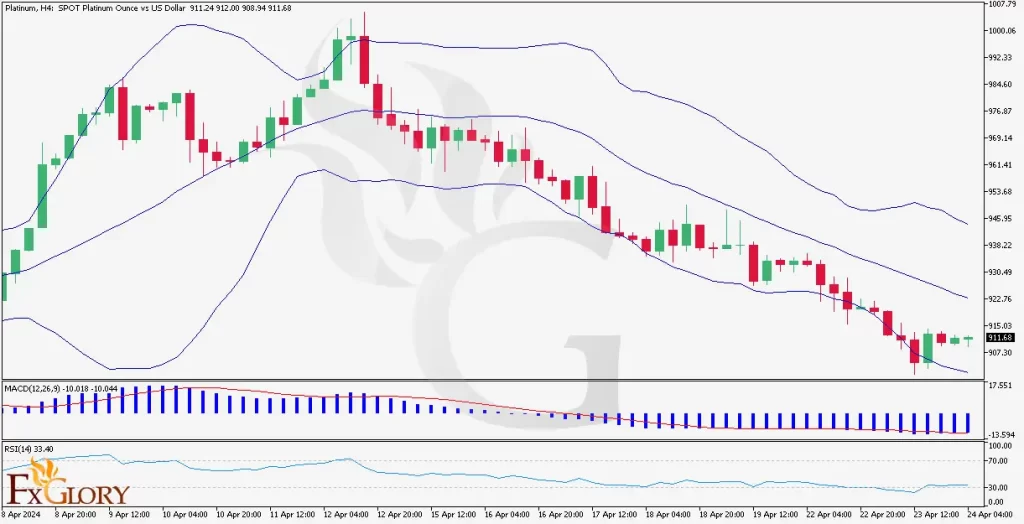
The platinum market on the H4 chart has been experiencing a downtrend, evidenced by the formation of lower highs and lower lows. Recently, there seems to be a slight bullish retracement, as the price has moved up from its latest low. This could suggest a temporary slowing down of the downward trend, possibly presenting a short-term buying opportunity.
Key Technical Indicators:
Bollinger Bands: Platinum’s price is hovering around the lower Bollinger Band, which usually indicates an oversold condition or a strong downtrend. A push back towards the middle band could signal a temporary reversal or consolidation.
RSI (Relative Strength Index): The RSI is below the 50-level, indicating bearish momentum. However, it is not in the oversold territory, leaving room for further downward movement or a potential reversal if the market sentiment shifts.
MACD (Moving Average Convergence Divergence): The MACD line is below the signal line and the histogram shows an increase in negative momentum, reinforcing the current bearish trend.
Support and Resistance:
Support: The most recent low acts as the immediate support level. Should the price break below this level, it may find further support near previous lows not visible on the current chart frame.
Resistance: Immediate resistance may be encountered at the level where the retracement began. A more significant resistance level would be where the price intersects with the middle Bollinger Band.
Conclusion and Consideration:
The current technical outlook for platinum on the H4 chart suggests a continuation of the bearish trend with a minor retracement in the short term. Traders should monitor the RSI for signs of a reversal and the MACD for changes in momentum. It is crucial to keep abreast of industrial and economic developments that could affect platinum prices. Risk management remains essential due to the inherent volatility in the commodities market.
Disclaimer: The provided analysis is for informational purposes only and does not constitute investment advice. Traders should conduct their own research and analysis before making any trading decisions.