Time Zone: GMT +2
Time Frame: 4 Hours (H4)
Fundamental Analysis:
The jobless report from the Department of Labor is to be published on April 18th and it is possible to highly affect gold prices. Basically, if the report shows fewer people are out of work than it was expected, it means the economy is probably doing alright, and the dollar could get stronger; and when the dollar bulks up, gold usually doesn’t shine as much, and its price could take a hit. On the flip side, if the report isn’t great and shows more people without jobs, it could mean trouble for the US economy, and the dollar might weaken. That’s when gold could start its next move, and we might see its price start to climb. Keep an eye on that report—it’s going to be a strong trading signal for where gold heads next!
Price Action:
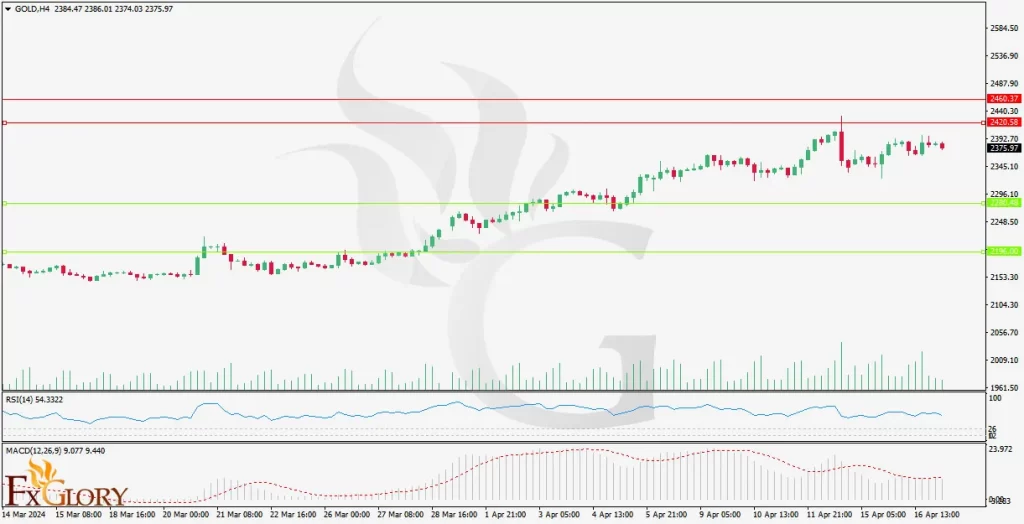
A technical analysis of the XAU/USD price action shows the commodity is approaching a significant resistance area between $2420 and $2460. This price level could serve as a turning point for the current bullish momentum. The candlestick formation on the H4 chart indicates that if the price fails to break through this resistance zone, a bearish wave may ensue, leading to potential target levels at $2280.00 and then $2196.50.
Key Technical Indicators:
MACD: The Moving Average Convergence Divergence (MACD) is showing signs of a potential sharp bearish wave as it forms lower tops, showing a potential finish to the current bullish momentum.
RSI: The Relative Strength Index (RSI) exhibits negative divergence, a bearish signal indicating that the upward price momentum is losing strength despite the increase in price.
Gold Bearish Signals:
There are a few bearish signals lining up for the gold market, hinting at a possible downturn. We’re seeing gold approach a resistance level that it might struggle to break through. At the same time, the MACD chart is shaping up in a way that suggests a bearish trend might be on the horizon, and the RSI indicator is also hinting at a downward swing with its negative divergence. When you fold the latest unemployment rate into this mix, it definitely adds an interesting angle to any gold price prediction. It looks like these technical signs, along with the fundamental economic data, are suggesting we keep our eyes peeled for a potential drop in gold prices.
While the market’s focus is often on short-term fluctuations, the broader view of gold’s fundamentals, coupled with technical analysis, provides insights for future gold price directions. The anticipation surrounding the unemployment rate forecast and its implications for monetary policy will be critical in shaping the long-term outlook for XAU/USD.
Conclusion:
Investors and traders considering the gold market must weigh both fundamental economic indicators and technical analysis. The impending unemployment report serves as a near-term catalyst that could influence investor sentiment and gold price trends. While technical indicators suggest the possibility of a bearish reversal, it’s imperative to stay updated with the upcoming fundamental news to make informed trading decisions.
Disclaimer: This analysis is for informational purposes only and does not constitute investment advice. Traders should conduct their own research and analysis before making any trading decisions.