Time Zone: GMT +2
Time Frame: 4 Hours (H4)
Fundamental Analysis:
In the commodities market, the spot price of Silver against the US Dollar is a reflection of the economic strength and demand for silver as an investment and industrial metal. Factors such as industrial demand, mining supply, interest rates, and economic indicators can influence the price of silver. Additionally, as silver is often seen as a safe-haven asset, it can attract investors during times of financial uncertainty.
Price Action:
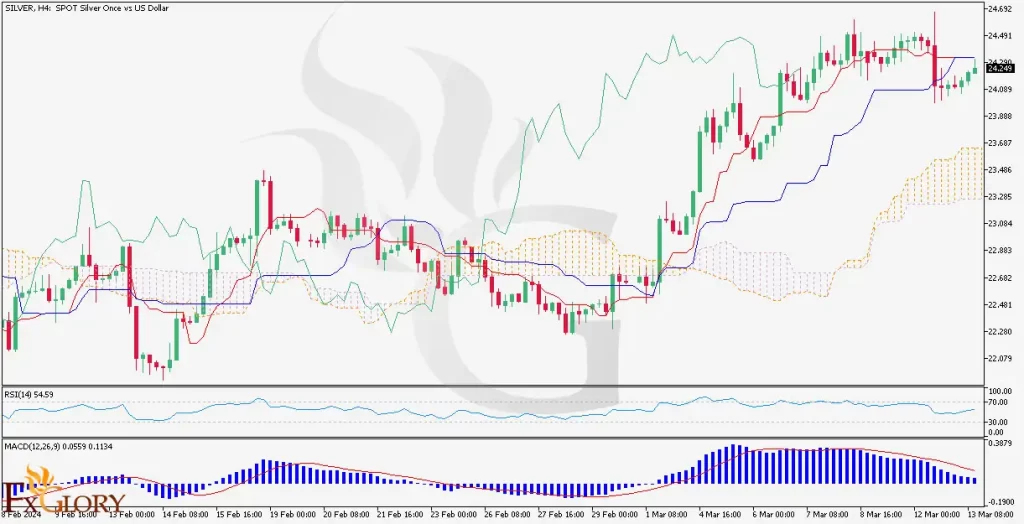
The Silver/USD H4 chart illustrates a fluctuating trend with some bullish momentum in recent sessions. The price action is characterized by movements within a defined range, showing no clear long-term trend but with recent inclines indicating potential bullish sentiment.
Key Technical Indicators:
Ichimoku Cloud: The price is above the Ichimoku cloud, suggesting a bullish outlook in the medium term. The cloud also acts as a support zone for the price.
MACD (Moving Average Convergence Divergence): The MACD line is above the signal line, indicating bullish momentum. However, the histogram shows a decrease in momentum, suggesting potential caution for bulls.
RSI (Relative Strength Index): The RSI is around 54.59, which is neutral, leaning towards bullish sentiment, indicating some buying pressure but not yet overbought.
Support and Resistance:
Support: The nearest key support level is around the lower boundary of the Ichimoku cloud, which could provide a floor for the current price.
Resistance: Immediate resistance is seen near recent highs, which could act as a ceiling for short-term price advances.
Conclusion and Consideration:
The technical analysis of the Silver/USD H4 chart shows a neutral to slightly bullish bias, with the price currently above the Ichimoku cloud and the MACD indicating a positive momentum. The RSI suggests there is room for upside before reaching overbought conditions. Traders should keep an eye on the interaction with the Ichimoku cloud for future price direction. It is also important to consider macroeconomic factors and the global financial climate, as they can have significant impacts on the price of silver. Utilizing sound risk management strategies and being prepared for potential volatility around key economic releases or geopolitical events is recommended.
Disclaimer: This analysis is for informational purposes only and should not be construed as investment advice. Always conduct your due diligence before trading.