
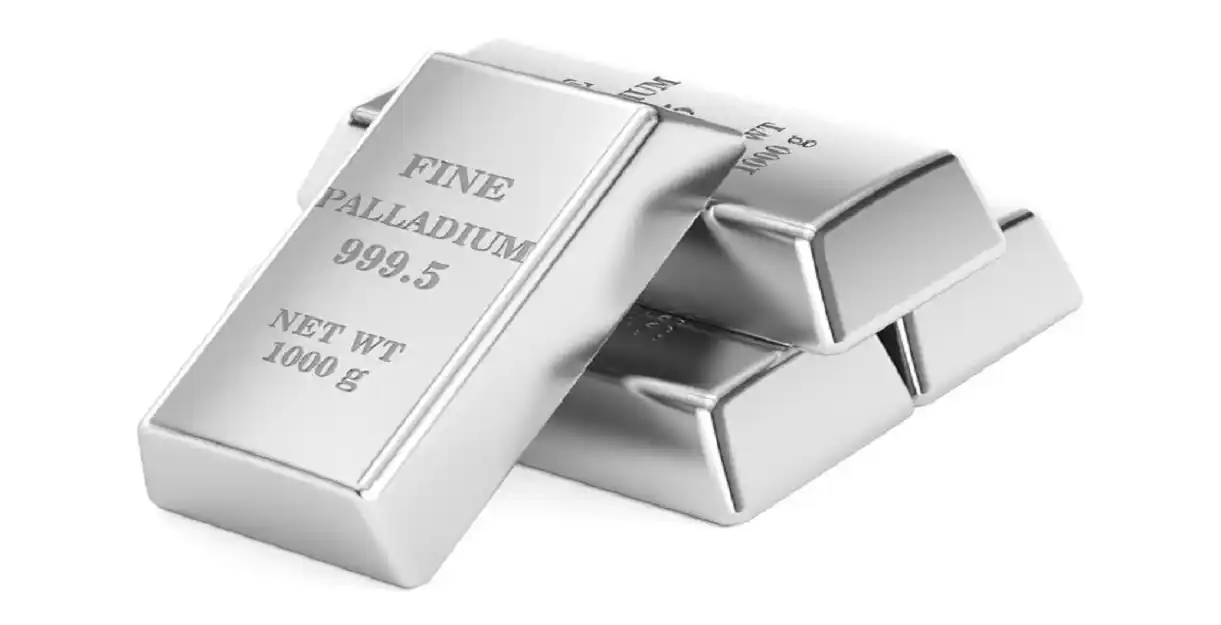
Palladium Forecast

PALLADIUM iconUSD icon
Palladium

SPOT Palladium Ounce vs US Dollar

Palladium Live Price

1201.46000
-4.85%

Palladium Forecast — 20 September 2026

Time Zone: GMT +3

Time Frame: Daily (D1) / Weekly Outlook

Weekly Fundamental Overview:

Palladium dynamics are closely linked to macroeconomic expectations, industrial demand forecasts, and broader risk sentiment. Market participants will be closely monitoring key economic data releases, including inflation gauges and labor market indicators, which could influence monetary policy expectations and impact industrial commodities like Palladium.

Price Action:

On the daily (D1) chart, Palladium (Palladium) recorded a last close of 1270.23. Recent price action shows the market consolidating within a range, having pulled back from brief spikes while maintaining a floor above key support at 1156.31 and remaining well below the overhead resistance at 1460.73.

Key Technical Indicators:

Bollinger Bands: The Bollinger Bands indicator on the daily time frame displays a middle band at 1332.09, an upper band at 1419.90, and a lower band at 1244.29. Palladium is currently trading in the lower half of the band structure, below the middle band, suggesting moderate bearish inclination.

RSI: The 14-day Relative Strength Index (RSI) is registered at 43.46. Operating below the neutral 50 threshold, the indicator reflects a mild bearish bias while staying above the oversold region.

MACD: The MACD indicator stands at -11.08, remaining in negative territory below the signal line. This configuration reflects persistent downward momentum in the daily timeframe, pointing to weak buying pressure.

Support and Resistance:

Technical chart analysis for Palladium highlights key support at 1156.31, bolstered closer by the lower Bollinger Band near 1244.29. On the resistance side, major overhead resistance is situated at 1460.73, with interim technical resistance located near the middle Bollinger Band at 1332.09.

News to Watch for Palladium This Week:

  • CB Consumer Confidence: Assesses overall consumer confidence which can affect economic growth sentiment and commodity demand.
  • JOLTS Job Openings: Reflects labor market demand and economic momentum.
  • ADP Non-Farm Employment Change: Serves as an early estimate of private sector employment strength.
  • Core PCE Price Index m/m: Functions as a vital inflation signal that can sway interest rate outlooks.
  • Final GDP q/q: Provides a comprehensive picture of economic growth and risk sentiment.
  • ISM Manufacturing PMI: Offers key insights into industrial activity that directly impacts physical metal usage.
  • Average Hourly Earnings m/m: Indicates wage growth trends and underlying inflationary pressures.
  • Non-Farm Employment Change: Acts as a primary benchmark for labor market expansion and macroeconomic health.
  • Unemployment Rate: Evaluates broader labor conditions that influence monetary policy expectations.

Weekly Outlook and Consideration:

The weekly outlook for Palladium (Palladium) suggests a cautious tone with a slight downside tilt following a close at 1270.23. With the RSI at 43.46 and MACD at -11.08, bears hold a slight technical advantage. Should price action break below near-term lower band support around 1244.29, a move toward the key support level at 1156.31 may develop. Conversely, if buyers regain momentum and reclaim the middle Bollinger Band at 1332.09, Palladium could attempt a recovery toward resistance at 1460.73. Traders should watch incoming macroeconomic catalysts for directional clarity.

Disclaimer: The analysis provided for Palladium is for informational purposes only and does not constitute investment advice. Traders are encouraged to perform their own analysis and research before making any trading decisions. Market conditions can change quickly, so staying informed with the latest data is essential.

Palladium D1 technical analysis chart
Palladium D1 Technical Analysis for 09.20.2026

Palladium Forecast — 12 September 2026

Time Zone: GMT +3

Time Frame: Daily (D1) / Weekly Outlook

Weekly Fundamental Overview:

Palladium market dynamics remain sensitive to global industrial demand and monetary policy expectations in the United States. Industrial consumption, particularly from the automotive sector, continues to set the broader tone for the metal. Meanwhile, shifting expectations around interest rates and potential US Dollar volatility significantly influence market participation across precious metals.

Price Action:

On the daily chart, Palladium has experienced sustained selling pressure over recent sessions, pushing prices down from recent swing highs. The instrument closed at 1273.78 after making a daily low near recent range levels. The series of lower daily closes reflects a corrective phase following brief attempts to push toward higher resistance zones.

Key Technical Indicators:

Bollinger Bands: The daily Bollinger Bands highlight an expanded volatility channel. The middle band is positioned at 1339.92, while the upper band stands at 1413.49 and the lower band at 1266.35. With Palladium closing at 1273.78 near the lower band, technical conditions indicate ongoing downward momentum within the current band boundaries.

RSI: The 14-day Relative Strength Index (RSI) stands at 42.89. This reading places Palladium in a neutral-to-bearish zone below the central 50 threshold, reflecting subdued buying interest without reaching extreme oversold territory.

MACD: The MACD indicator currently records a reading of 7.30. Although remaining in positive territory, the signal line and histogram reflect weakening upside momentum as recent price declines erode previous gains.

Support and Resistance:

Key daily technical levels show primary support established at 1145.21, providing a potential buffer against further declines. On the upside, major resistance is located at 1460.73, marking the upper boundary for any potential bullish recovery.

News to Watch for Palladium This Week:

  • Core Retail Sales m/m: Measures consumer spending changes excluding automotive sales to gauge US economic strength.
  • Retail Sales m/m: Provides a broad indicator of consumer demand that can impact interest rate expectations.
  • FOMC Economic Projections: Outlines official Federal Reserve expectations for growth, inflation, and interest rates.
  • FOMC Statement: Details monetary policy decisions that influence overall USD strength and commodity prices.
  • Federal Funds Rate: Sets the baseline interest rate decision directly influencing non-yielding asset demand.
  • FOMC Press Conference: Delivers essential commentary on monetary policy direction and economic risk factors.
  • Unemployment Claims: Tracks weekly US labor market claims to assess economic momentum.

Weekly Outlook and Consideration:

The weekly perspective for Palladium remains cautious as technical indicators lean toward consolidation near lower band levels. With price settling at 1273.78 near the 1266.35 lower Bollinger Band and RSI at 42.89, traders are observing whether support at 1145.21 will hold if downward pressure persists. High-impact macroeconomic events, including US Retail Sales and the FOMC policy decision, will be crucial drivers for market sentiment and could catalyze sharp swings across precious metals.

Disclaimer: The analysis provided for Palladium is for informational purposes only and does not constitute investment advice. Traders are encouraged to perform their own analysis and research before making any trading decisions. Market conditions can change quickly, so staying informed with the latest data is essential.

Palladium D1 technical analysis chart
Palladium D1 Technical Analysis for 09.12.2026

Palladium Forecast — 5 September 2026

Time Zone: GMT +3

Time Frame: Daily (D1) / Weekly Outlook

Weekly Fundamental Overview:

Palladium (Palladium) continues to be influenced by broader macroeconomic trends, shifting interest rate expectations, and demand across industrial sectors. Upcoming economic releases from the United States, including producer and consumer price indices along with consumer sentiment data, may shape market expectations regarding monetary policy and influence price dynamics across precious metals markets.

Price Action:

On the daily D1 chart, Palladium recently advanced to close at 1412.83, recovering from a recent low of 1301.22 earlier in the period. The price action demonstrates a recent bullish drive that brings the asset closer to testing the established technical resistance zone.

Key Technical Indicators:

Bollinger Bands: The daily Bollinger Bands reveal a middle band at 1342.03, an upper band at 1410.63, and a lower band at 1273.43. With the current close at 1412.83, Palladium is trading slightly above the upper band, indicating strong recent upward momentum relative to its moving average.

RSI: The 14-day Relative Strength Index (RSI) stands at 59.34, placing the asset in moderate bullish territory while remaining below the overbought threshold of 70.

MACD: The MACD indicator for Palladium sits at 17.68, remaining in positive territory above the zero baseline. This positive value reflects upward momentum on the daily timeframe, supporting recent buying interest.

Support and Resistance:

Key technical levels for Palladium include primary resistance at 1460.73 and primary support at 1145.21, which define the broader trading range on the daily chart.

News to Watch for Palladium This Week:

  • PPI m/m: This release measures producer price changes and can impact inflation expectations surrounding precious metals.
  • Core PPI m/m: Excluded volatile categories provide a clearer view of underlying wholesale cost trends.
  • Unemployment Claims: Weekly jobless claims offer insights into labor market conditions and broader economic health.
  • Core CPI m/m: Consumer inflation metrics influence monetary policy expectations and market sentiment.
  • CPI y/y: The annual consumer inflation rate provides critical context for interest rate trajectories.
  • Core CPI y/y: Year-over-year core figures help traders assess underlying inflation persistence.
  • CPI m/m: Monthly inflation data highlights recent shifts in price pressures across the economy.
  • Prelim UoM Inflation Expectations: Long-term consumer inflation surveys can impact store-of-value assets.
  • Prelim UoM Consumer Sentiment: Sentiment metrics reflect consumer confidence and general economic outlooks.

Weekly Outlook and Consideration:

Palladium enters the week positioned at 1412.83, supported by an RSI reading of 59.34 and a positive MACD value of 17.68. The current price trades near the upper Bollinger Band of 1410.63, pointing to recent upward strength. Traders will monitor whether momentum can sustain a push toward resistance at 1460.73 or if price action will pull back toward the middle Bollinger Band at 1342.03 and deeper support at 1145.21, particularly as major U.S. economic data releases unfold.

Disclaimer: The analysis provided for Palladium is for informational purposes only and does not constitute investment advice. Traders are encouraged to perform their own analysis and research before making any trading decisions. Market conditions can change quickly, so staying informed with the latest data is essential.

Palladium D1 technical analysis chart
Palladium D1 Technical Analysis for 09.05.2026

Palladium Forecast — 22 August 2026

Time Zone: GMT +3

Time Frame: Daily (D1) / Weekly Outlook

Weekly Fundamental Overview:

Palladium (Palladium) price dynamics continue to be shaped by broader macroeconomic expectations, industrial demand forecasts, and US economic performance. Major US macroeconomic indicators and growth data closely influence monetary policy expectations, which directly affect precious metal valuations and risk sentiment across financial markets.

Price Action:

On the daily chart (D1), Palladium (Palladium) recently rebounded from lower bounds to register a close at 1322.78. Price action reflects consolidation above key moving midpoints, holding higher after experiencing swings toward upper resistance areas.

Key Technical Indicators:

Bollinger Bands: The daily Bollinger Bands for Palladium indicate a middle band at 1312.27, an upper band at 1400.09, and a lower band at 1224.46. Trading at 1322.78, Palladium remains positioned just above the middle line, maintaining a neutral to slightly positive posture within the volatility channel.

RSI: The 14-day Relative Strength Index (RSI) stands at 52.47. Positioned near the neutral 50 level, the oscillator indicates a balanced market condition without immediate overbought or oversold pressure on Palladium (Palladium).

MACD: The D1 MACD indicator posts a reading of 12.18, remaining above the zero line. This positive value points to underlying bullish momentum, though traders monitor price action closely for signs of trend continuation or potential momentum exhaustion.

Support and Resistance:

Key technical levels for Palladium (Palladium) feature main resistance at 1398.77 and strong support at 1145.21. Additional dynamic reference points include the upper Bollinger band at 1400.09 and the lower band at 1224.46.

News to Watch for Palladium This Week:

  • CB Consumer Confidence: Reflects overall consumer sentiment which can drive shifts in dollar valuation and commodity markets.
  • Core PCE Price Index m/m: Serves as a key inflation indicator that directly influences central bank interest rate expectations.
  • Prelim GDP q/q: Measures economic expansion and provides insight into underlying demand conditions across commodities.
  • Prelim GDP Price Index q/q: Offers broad inflationary detail that impacts economic outlooks and investor risk appetite.
  • Unemployment Claims: Indicates the health of the labor market and influences short-term currency momentum.
  • Prelim Benchmark Payrolls Revision: Provides adjusted employment data that can recalibrate expectations for monetary policy.

Weekly Outlook and Consideration:

Palladium (Palladium) enters the session with a balanced outlook after closing at 1322.78. Supported by a middle Bollinger Band level of 1312.27 and a positive MACD of 12.18, price action shows potential to test upper resistance near 1398.77. However, with an RSI of 52.47 showing neutral market momentum, any downside pullbacks could lead price toward support around the lower band at 1224.46 or lower support at 1145.21 if market sentiment weakens.

Disclaimer: The analysis provided for Palladium is for informational purposes only and does not constitute investment advice. Traders are encouraged to perform their own analysis and research before making any trading decisions. Market conditions can change quickly, so staying informed with the latest data is essential.

Palladium Forecast — 15 August 2026

Time Zone: GMT +3

Time Frame: Daily (D1) / Weekly Outlook

Weekly Fundamental Overview:

Palladium markets remain sensitive to broader macroeconomic conditions, industrial demand trends, and Federal Reserve policy expectations. Fluctuations in risk sentiment and global growth expectations continue to shape short-term trading momentum in the metal space.

Price Action:

Palladium (Palladium) pulled back from recent daily high levels near the 1398.77 mark, with the last daily close settling at 1301.93. The recent downward candle brought price back toward key moving averages, indicating a pause in the previous upward momentum.

Key Technical Indicators:

Bollinger Bands: The daily Bollinger Bands place the middle line at 1299.01, with the upper band at 1398.13 and the lower band at 1199.89. Palladium is currently trading near the middle band, reflecting a transition into a potential consolidation phase after testing upper band resistance.

RSI: The 14-day Relative Strength Index (RSI) stands at 49.66. This neutral reading indicates a balanced market posture, sitting right around the midpoint without entering overbought or oversold territory.

MACD: The MACD indicator is currently reading 22.57, holding above the zero line. This suggests that positive underlying momentum remains active on the daily timeframe despite recent price pullbacks.

Support and Resistance:

Key technical support is located at 1145.21, while key resistance is situated at 1398.77.

News to Watch for Palladium This Week:

  • Prelim Benchmark Payrolls Revision: Significant revisions can impact US dollar valuation and alter risk sentiment across precious metals markets.
  • FOMC Meeting Minutes: Detailed discussions regarding central bank interest rate policy can directly influence commodity demand and dollar pricing.
  • Unemployment Claims: Insights into labor market conditions provide key signals regarding economic strength and policy trajectory.
  • Philly Fed Manufacturing Index: Regional manufacturing health offers clues about industrial demand expectations for metals.
  • Flash Manufacturing PMI: Early readings on business activity provide crucial context for economic growth and commodity consumption.

Weekly Outlook and Consideration:

Palladium (Palladium) enters the week in a neutral technical posture, resting at 1301.93 near the middle Bollinger Band at 1299.01. With an RSI near 49.66 and a positive MACD of 22.57, the market displays potential for range-bound price action between technical support at 1145.21 and resistance at 1398.77. A decisive move above upper resistance or below middle support will likely determine the broader directional trend over coming sessions.

Disclaimer: The analysis provided for Palladium is for informational purposes only and does not constitute investment advice. Traders are encouraged to perform their own analysis and research before making any trading decisions. Market conditions can change quickly, so staying informed with the latest data is essential.

Palladium D1 technical analysis chart
Palladium D1 Technical Analysis for 08.15.2026
1Palladium = –––USD –––% ▼
Palladium
Loading chart...
