Time Zone: GMT +3
Time Frame: Daily (D1) / Weekly Outlook
Weekly Fundamental Overview:
The NZD/JPY pair continues to be driven by shifting global risk sentiment and monetary policy expectations surrounding central banks in Japan and New Zealand. Market participants are closely watching upcoming economic data releases and official commentary to gauge potential policy shifts and broader market direction.
Price Action:
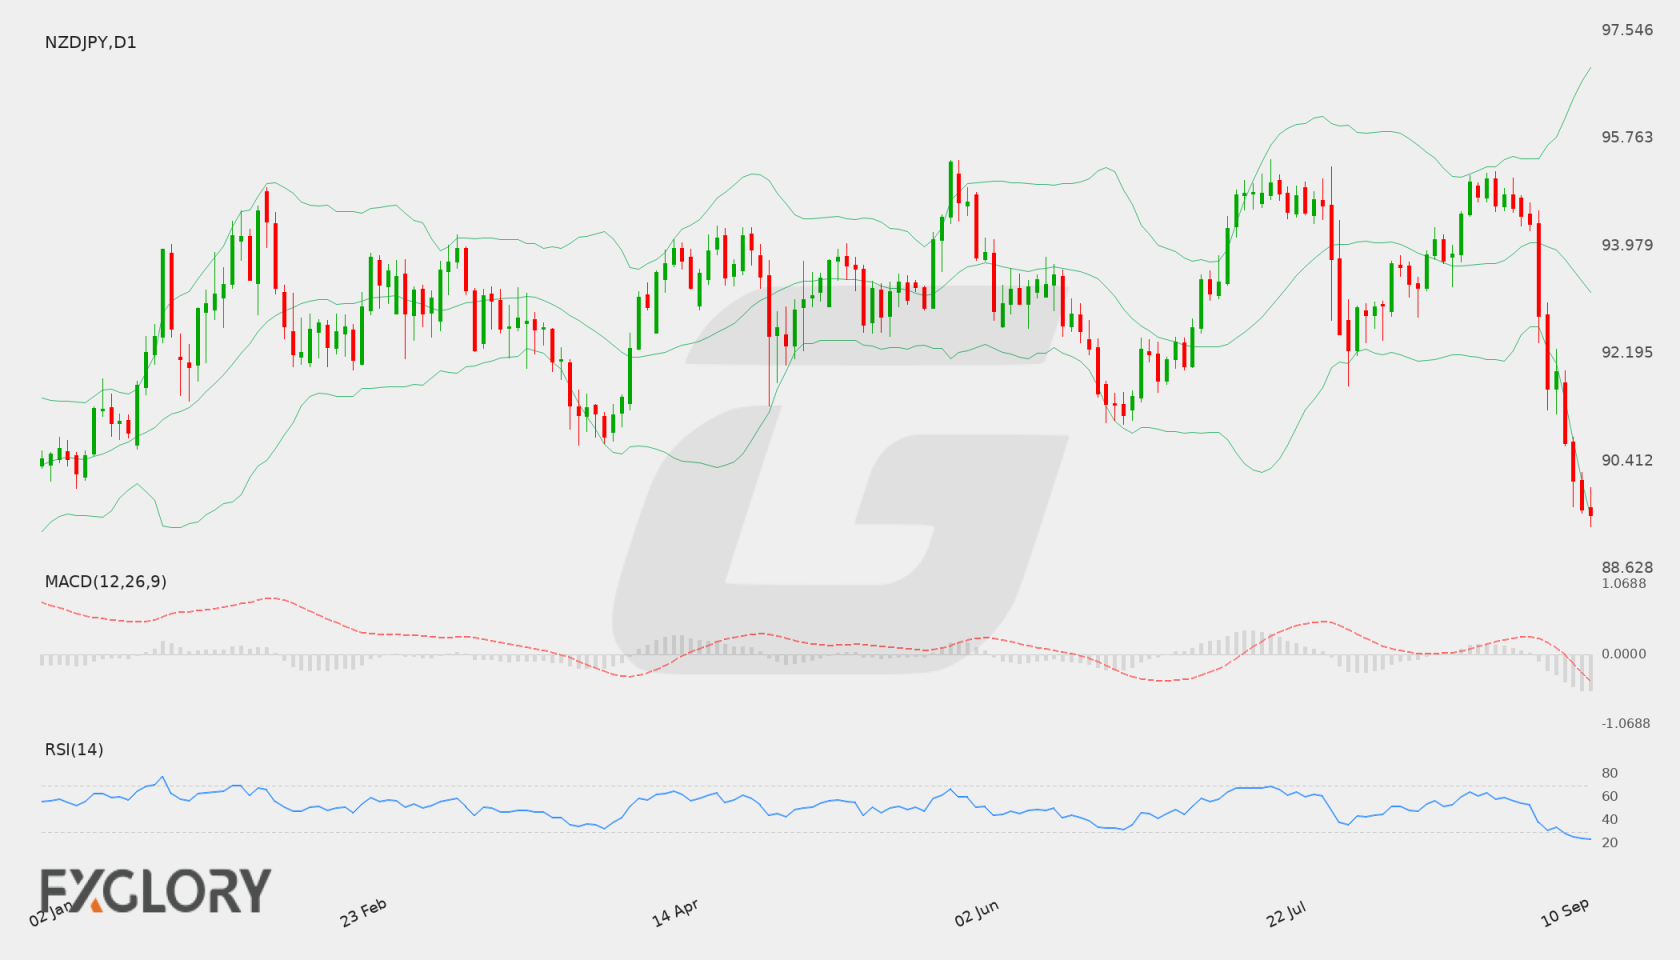
On the Daily (D1) chart, NZD/JPY has experienced a sharp decline from recent highs near 95.00 down to close at 89.511. The pair recently tested lows near the primary technical support level of 89.316, reflecting persistent selling momentum over recent trading sessions.
Key Technical Indicators:
Bollinger Bands: Bollinger Bands analysis on the daily timeframe places the middle band at 93.2036, the upper band at 96.9312, and the lower band at 89.4760. With the latest close at 89.511 sitting right near the lower band, price action reflects elevated downside momentum and trades near the lower threshold of its recent range.
RSI: The 14-period RSI currently reads 23.49, placing NZD/JPY firmly in oversold territory on the daily chart. While this highlights strong recent selling pressure, oversold levels can also signal the potential for a temporary stabilization or technical pullback.
MACD: The MACD line is recorded at -0.9717, remaining deep below the zero line. This indicates that bearish momentum continues to dominate the daily chart, though traders will watch for any signs of a momentum shift or convergence.
Support and Resistance:
Key short-term support is located at 89.316 near recent daily lows, while primary resistance is established at 95.415. Intermediate resistance on any upward recovery sits near the daily middle Bollinger band around 93.2036.
News to Watch for NZDJPY This Week:
- GDP q/q: Growth statistics provide valuable insight into economic activity and broad macroeconomic health.
- Monetary Policy Statement: Offers detailed guidance on future monetary stance and macroeconomic forecasts.
- BOJ Press Conference: Outlines central bank monetary policy decisions and future guidance.
- BOJ Policy Rate: Changes to interest rate settings directly influence currency valuations and market yields.
Weekly Outlook and Consideration:
NZD/JPY remains under heavy downside pressure following a drop to 89.511. However, with the RSI showing oversold conditions at 23.49 and price approaching the key support level of 89.316 alongside the lower Bollinger band at 89.4760, sellers may encounter strong technical resistance. A breach below support could open the door for further downside, whereas a failure to break lower might allow for a consolidation phase or rebound toward 93.2036.
Disclaimer: The analysis provided for NZD/JPY is for informational purposes only and does not constitute investment advice. Traders are encouraged to perform their own analysis and research before making any trading decisions. Market conditions can change quickly, so staying informed with the latest data is essential.