Time Zone: GMT +3
Time Frame: Daily (D1) / Weekly Outlook
Weekly Fundamental Overview:
XRP/USD trading conditions remain sensitive to broader risk sentiment in crypto markets and macroeconomic indicators affecting the US dollar. As liquidity shifts across global financial markets, upcoming US economic releases could drive volatility, directly influencing risk assets like XRP/USD. Traders continue to monitor shift in market sentiment alongside major US macroeconomic data for clear directional cues.
Price Action:
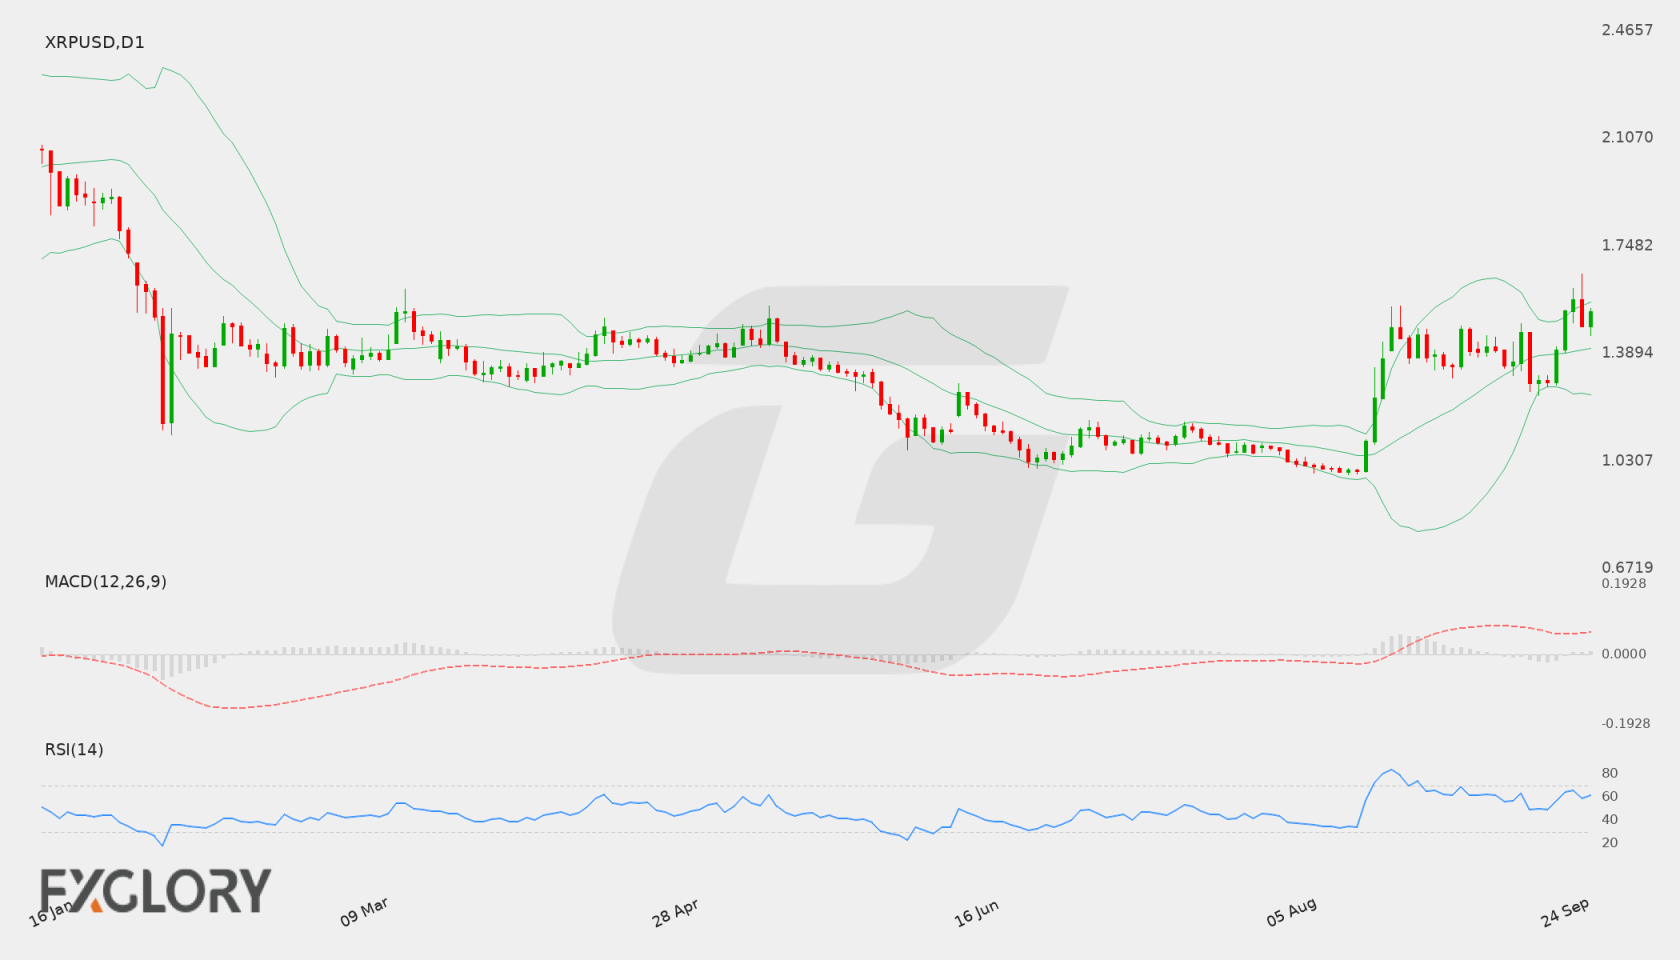
On the daily (D1) chart, XRP/USD has demonstrated strong upward momentum, surging from recent lows near 1.2905 up toward recent highs of 1.6539 before settling at a last close of 1.5280. The recent candlestick structure shows active buyers absorbing intraday pullbacks, keeping price action positioned firmly in positive territory over the recent trading sessions.
Key Technical Indicators:
Bollinger Bands: The daily Bollinger Bands highlight an expanded volatility envelope for XRP/USD, with the middle band located at 1.4051, the upper band at 1.5598, and the lower band at 1.2503. Trading at a close of 1.5280, the price remains elevated in the upper half of the band structure, approaching the upper band limit.
RSI: The 14-day Relative Strength Index (RSI) is currently reading 61.06. This places XRP/USD in bullish territory above the neutral 50 level, reflecting healthy buying pressure while staying clear of extreme overbought conditions.
MACD: The MACD indicator on the D1 timeframe stands at 0.0675, printing positive values above the signal baseline. This bullish reading indicates that upward momentum currently dominates short-to-medium term price development for XRP/USD.
Support and Resistance:
Key technical levels on the daily chart frame the current trading boundary, with primary resistance established at 1.6539 and primary support identified at 0.9855.
News to Watch for XRPUSD This Week:
- ISM Manufacturing PMI: Tracks overall business conditions in the US manufacturing sector, potential risk-sentiment catalyst for digital assets.
- ISM Manufacturing Prices: Measures input price inflation, providing clues on broader macroeconomic policy expectations that can impact the US dollar.
Weekly Outlook and Consideration:
The weekly perspective for XRP/USD remains constructive according to daily technical indicators. With the price holding at 1.5280, supported above the 20-day middle Bollinger band of 1.4051 and sustained by a positive MACD of 0.0675 and RSI of 61.06, bulls appear in control. A sustained move beyond the upper Bollinger band near 1.5598 could bring primary resistance at 1.6539 into focus, while a retracement could find initial stabilization near the middle band before testing primary support at 0.9855.
Disclaimer: The analysis provided for XRP/USD is for informational purposes only and does not constitute investment advice. Traders are encouraged to perform their own analysis and research before making any trading decisions. Market conditions can change quickly, so staying informed with the latest data is essential.