Time Zone: GMT +3
Time Frame: Daily (D1) / Weekly Outlook
Weekly Fundamental Overview:
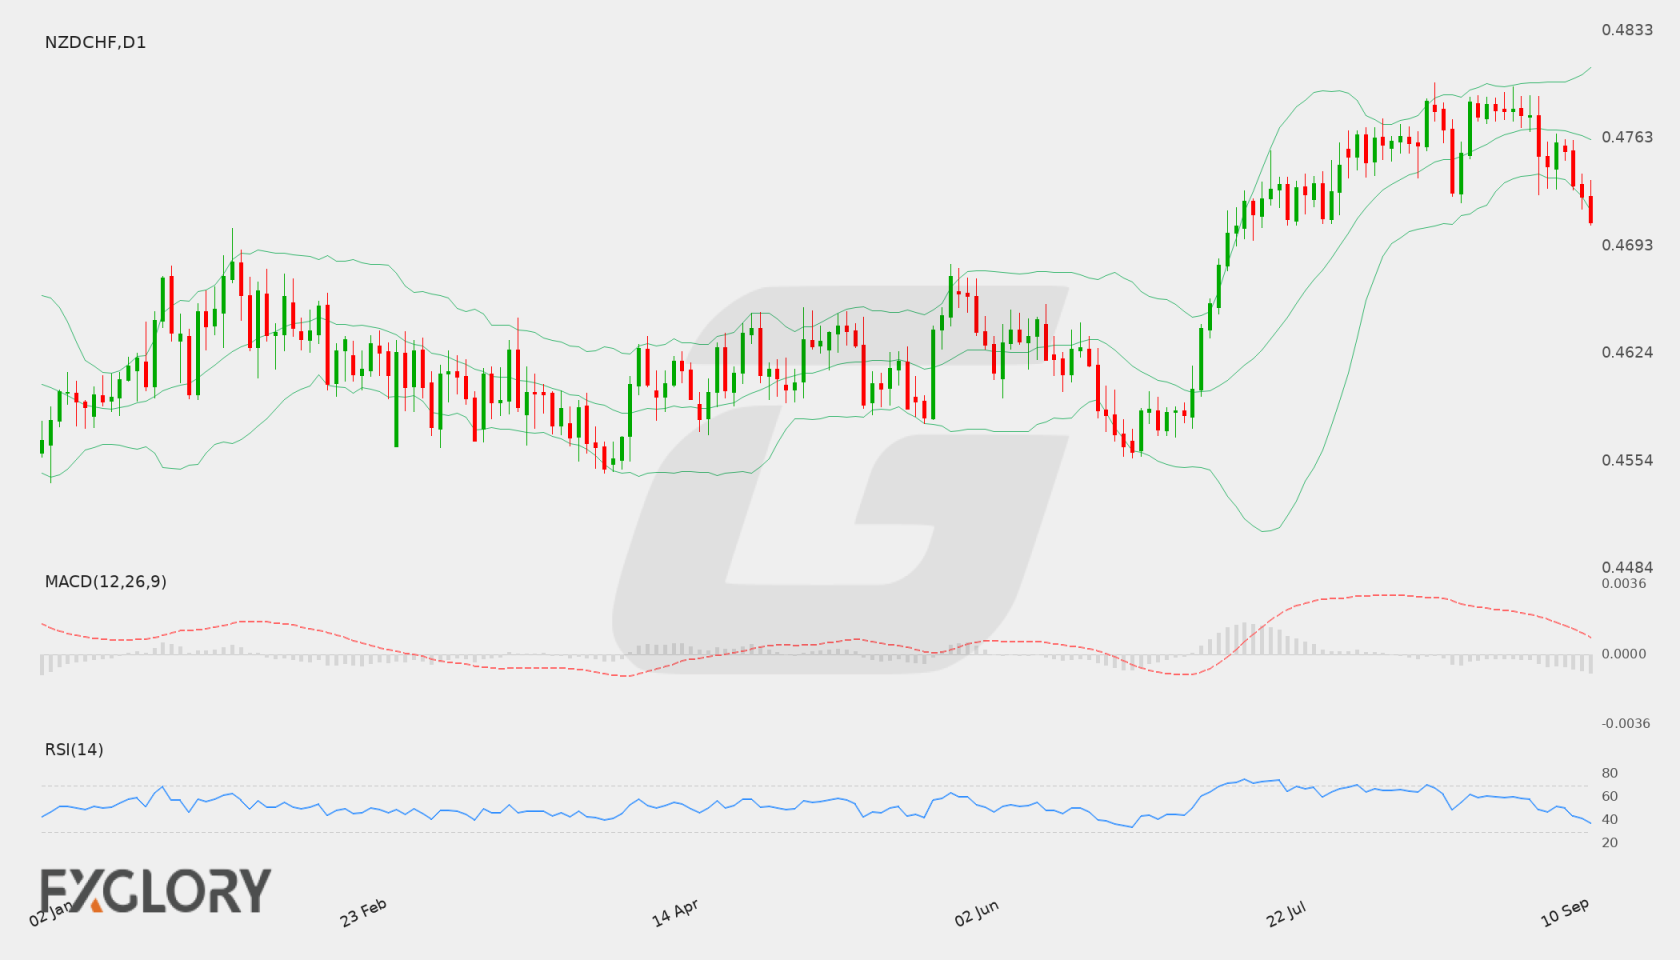
The NZD/CHF currency pair experienced downward pressure over recent daily sessions, sliding from levels near 0.47820 down toward 0.47087. Divergent market sentiment and evolving central bank expectations continue to dictate price behavior between the New Zealand Dollar and the Swiss Franc.
Price Action:
Daily price action shows a consistent sequence of lower closes, dropping from 0.47820 to the recent close of 0.47087. Bearish momentum has dominated the recent sessions, dragging the pair toward lower structural boundaries on the D1 chart.
Key Technical Indicators:
Bollinger Bands: The daily Bollinger Bands feature a middle band at 0.47626, an upper band at 0.48091, and a lower band at 0.47160. The latest close at 0.47087 sits below the lower Bollinger Band, indicating stretched downside movement.
RSI: The 14-day Relative Strength Index (RSI) registers at 37.42. This reading reflects subdued buying interest and moves the oscillator closer to oversold territory without signaling a confirmed reversal.
MACD: The MACD indicator on the D1 chart holds a negative value of -0.00015. This positioning below the zero line aligns with the prevailing bearish trend observed across daily price action.
Support and Resistance:
Key technical levels derived from daily chart analysis highlight resistance at 0.47995 and main support situated at 0.45558.
News to Watch for NZDCHF This Week:
- PPI m/m: This release offers insights into producer inflation trends that can influence monetary policy expectations.
- GDP q/q: This quarterly report reflects overall economic growth momentum and can impact currency valuation.
Weekly Outlook and Consideration:
Heading into the new trading week, NZD/CHF carries a cautious technical outlook after closing at 0.47087. Indicator signals remain subdued, with MACD at -0.00015, RSI at 37.42, and price trading underneath the lower Bollinger Band of 0.47160. Market participants will focus on whether price stabilizes above support at 0.45558 or attempts a rebound toward resistance at 0.47995, while monitoring high-impact calendar events such as PPI m/m and GDP q/q.
Disclaimer: The analysis provided for NZD/CHF is for informational purposes only and does not constitute investment advice. Traders are encouraged to perform their own analysis and research before making any trading decisions. Market conditions can change quickly, so staying informed with the latest data is essential.