Time Zone: GMT +3
Time Frame: Daily (D1) / Weekly Outlook
Weekly Fundamental Overview:
Broader risk sentiment and monetary policy developments involving central banks remain primary drivers for AUD/JPY (AUDJPY), with traders monitoring macroeconomic trends and yield differentials for directional cues.
Price Action:
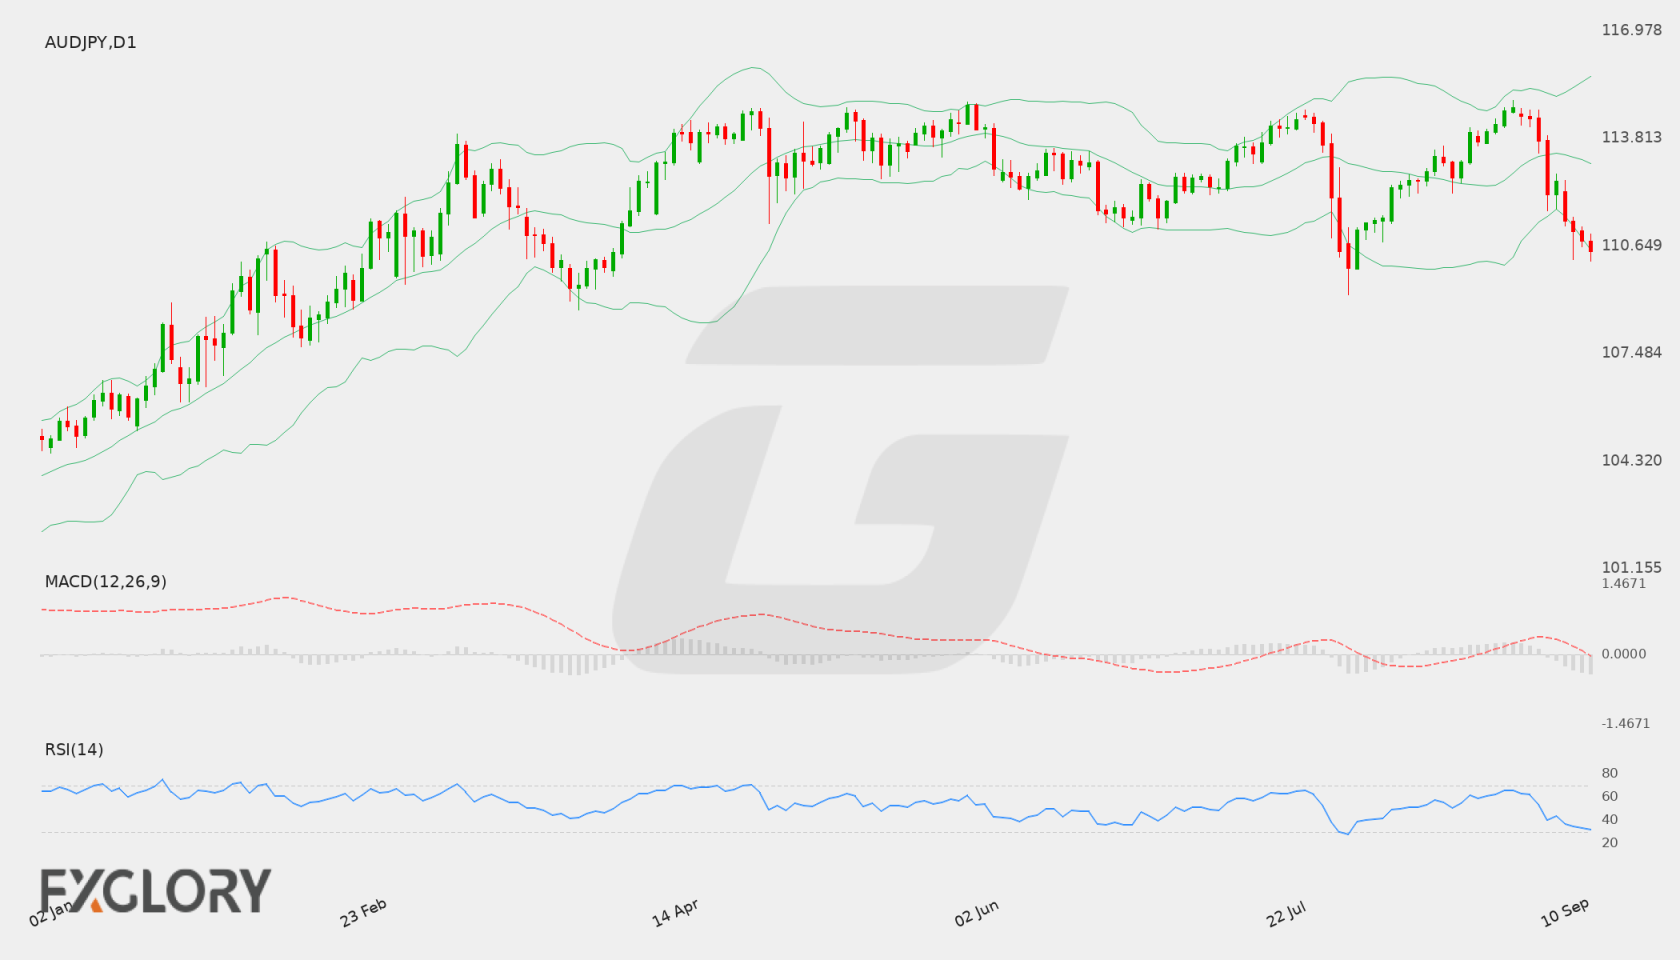
On the Daily (D1) timeframe, AUD/JPY (AUDJPY) has moved sharply lower in recent sessions, descending from above the 114.00 level down toward a recent close of 110.51, reflecting continuous downside pressure.
Key Technical Indicators:
Bollinger Bands: The D1 Bollinger Bands show the pair trading right at the lower band of 110.519, well below the middle band at 113.073 and upper band at 115.627, pointing to elevated downward volatility.
RSI: The 14-day RSI stands at 31.67, lingering near oversold territory and pointing to intense selling momentum that may eventually prompt consolidation or a technical pause.
MACD: The MACD indicator registers at -0.448, holding below its zero line to indicate that bearish momentum currently controls the broader daily structure for AUD/JPY (AUDJPY).
Support and Resistance:
Immediate key technical support for AUD/JPY (AUDJPY) is positioned at 109.212, while primary resistance sits higher at 114.938.
News to Watch for AUDJPY This Week:
- Monetary Policy Statement: Detailed policy assessments within this statement provide insight into economic projections and future policy adjustments.
- BOJ Press Conference: Statements delivered during this press event offer crucial guidance regarding interest rate trajectories and economic outlooks.
- BOJ Policy Rate: Benchmark interest rate decisions directly influence currency valuations and broader capital flow movements.
Weekly Outlook and Consideration:
AUD/JPY (AUDJPY) enters the week facing ongoing downward pressure, with the daily close of 110.51 sitting directly at the lower Bollinger Band of 110.519. The MACD reading of -0.448 underscores active bearish momentum, while an RSI of 31.67 signals that price action is approaching oversold territory. Should selling pressure persist, the market could test primary support around 109.212. Alternatively, a relief pullback could see the pair move back toward the middle Bollinger Band at 113.073 before potentially challenging major resistance near 114.938.
Disclaimer: The analysis provided for AUD/JPY is for informational purposes only and does not constitute investment advice. Traders are encouraged to perform their own analysis and research before making any trading decisions. Market conditions can change quickly, so staying informed with the latest data is essential.