Time Zone: GMT +3
Time Frame: Daily (D1) / Weekly Outlook
Weekly Fundamental Overview:
USD/SGD price action continues to be heavily influenced by broader macroeconomic conditions in the United States and global risk sentiment. Expectations around federal monetary policy and key upcoming US inflation updates remain central drivers for directional momentum in the pair.
Price Action:
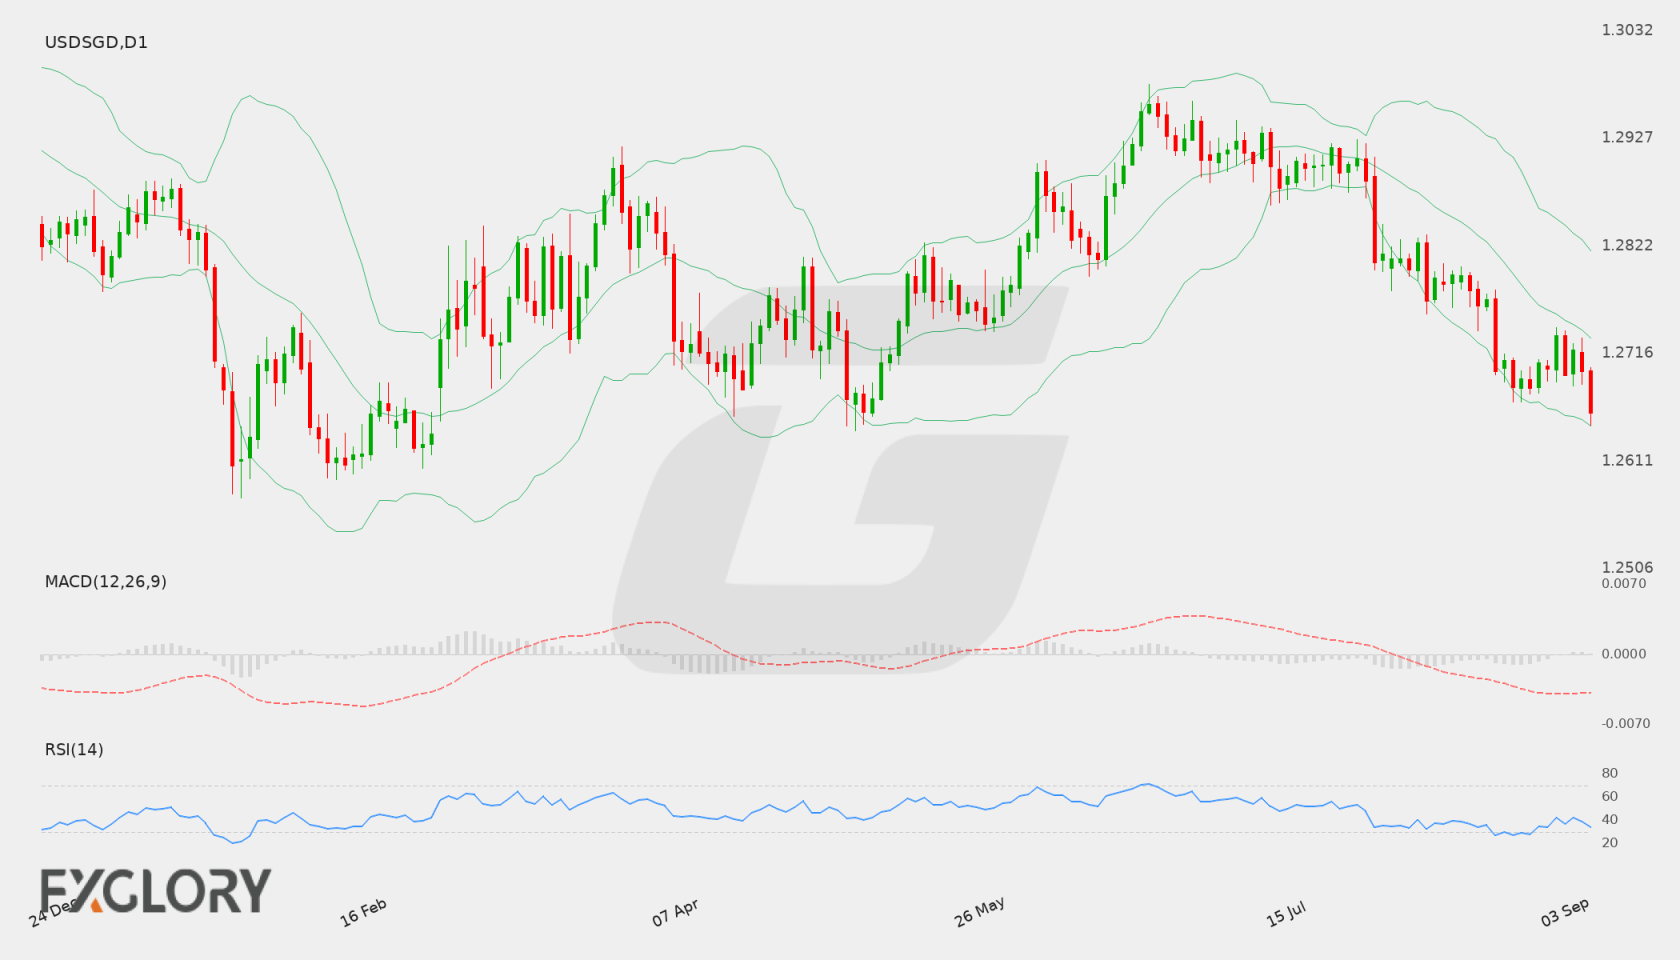
On the daily chart, USD/SGD has shown a steady downward trajectory over recent sessions, with the latest daily close at 1.26589. The pair has pressed lower from previous consolidated levels, signaling strong selling pressure as price action trades near recent multi-session lows.
Key Technical Indicators:
Bollinger Bands: The Bollinger Bands display a middle boundary at 1.27313, an upper band at 1.28171, and a lower band at 1.26454. With the last close sitting at 1.26589, spot price is hugging the lower band, reflecting heightened downside volatility and persistent bearish momentum.
RSI: The 14-period Relative Strength Index (RSI) stands at 33.58. This reading places the indicator near oversold territory, reflecting weak bullish momentum and potential exhaustion if downside pressure diminishes.
MACD: The daily MACD indicator is currently recorded at -0.00386, remaining below the zero signal line. This negative value indicates that short-term momentum continues to favor sellers relative to longer-term trends.
Support and Resistance:
Key technical levels for USD/SGD highlight immediate daily support near 1.26461. On the upside, major resistance is located at 1.29797, with intermediate resistance aligned near the middle Bollinger Band at 1.27313.
News to Watch for USDSGD This Week:
- PPI m/m: This release measures wholesale price trends that can signal broader inflation pressures impacting interest rate expectations.
- Core PPI m/m: Excludes volatile food and energy costs to provide a clearer signal on underlying producer inflation.
- Unemployment Claims: Offers a weekly gauge of labor market resilience that influences overall economic outlooks.
- Core CPI m/m: Tracks underlying monthly consumer price shifts that heavily influence monetary policy projections.
- CPI y/y: Highlights headline annual inflation trends that shape market sentiment regarding economic health.
- Core CPI y/y: Measures persistent annual consumer price changes crucial for evaluating long-term monetary policy.
- CPI m/m: Details short-term consumer price movements that can alter immediate rate forecasts.
- Prelim UoM Inflation Expectations: Reflects consumer outlooks on future price trends which influence economic expectations.
- Prelim UoM Consumer Sentiment: Indicates overall consumer confidence levels that impact broader market risk sentiment.
Weekly Outlook and Consideration:
USD/SGD heads into the week under prevailing bearish momentum, with price action hovering near key lower technical boundaries. Daily indicators such as the negative MACD and an RSI near oversold levels underscore current weakness. A break below immediate support at 1.26461 could extend downside pressure, while a rebound would need to overcome resistance at 1.27313 and 1.29797 to establish neutral ground. Market dynamics will likely be shaped by incoming US economic data.
Disclaimer: The analysis provided for USD/SGD is for informational purposes only and does not constitute investment advice. Traders are encouraged to perform their own analysis and research before making any trading decisions. Market conditions can change quickly, so staying informed with the latest data is essential.