Time Zone: GMT +3
Time Frame: Daily (D1) / Weekly Outlook
Weekly Fundamental Overview:
NZD/JPY remains heavily influenced by shifts in risk sentiment and interest rate expectations surrounding both the Reserve Bank of New Zealand and the Bank of Japan. Economic data and central bank signals from both economies play a crucial role in directing short-term trend direction.
Price Action:
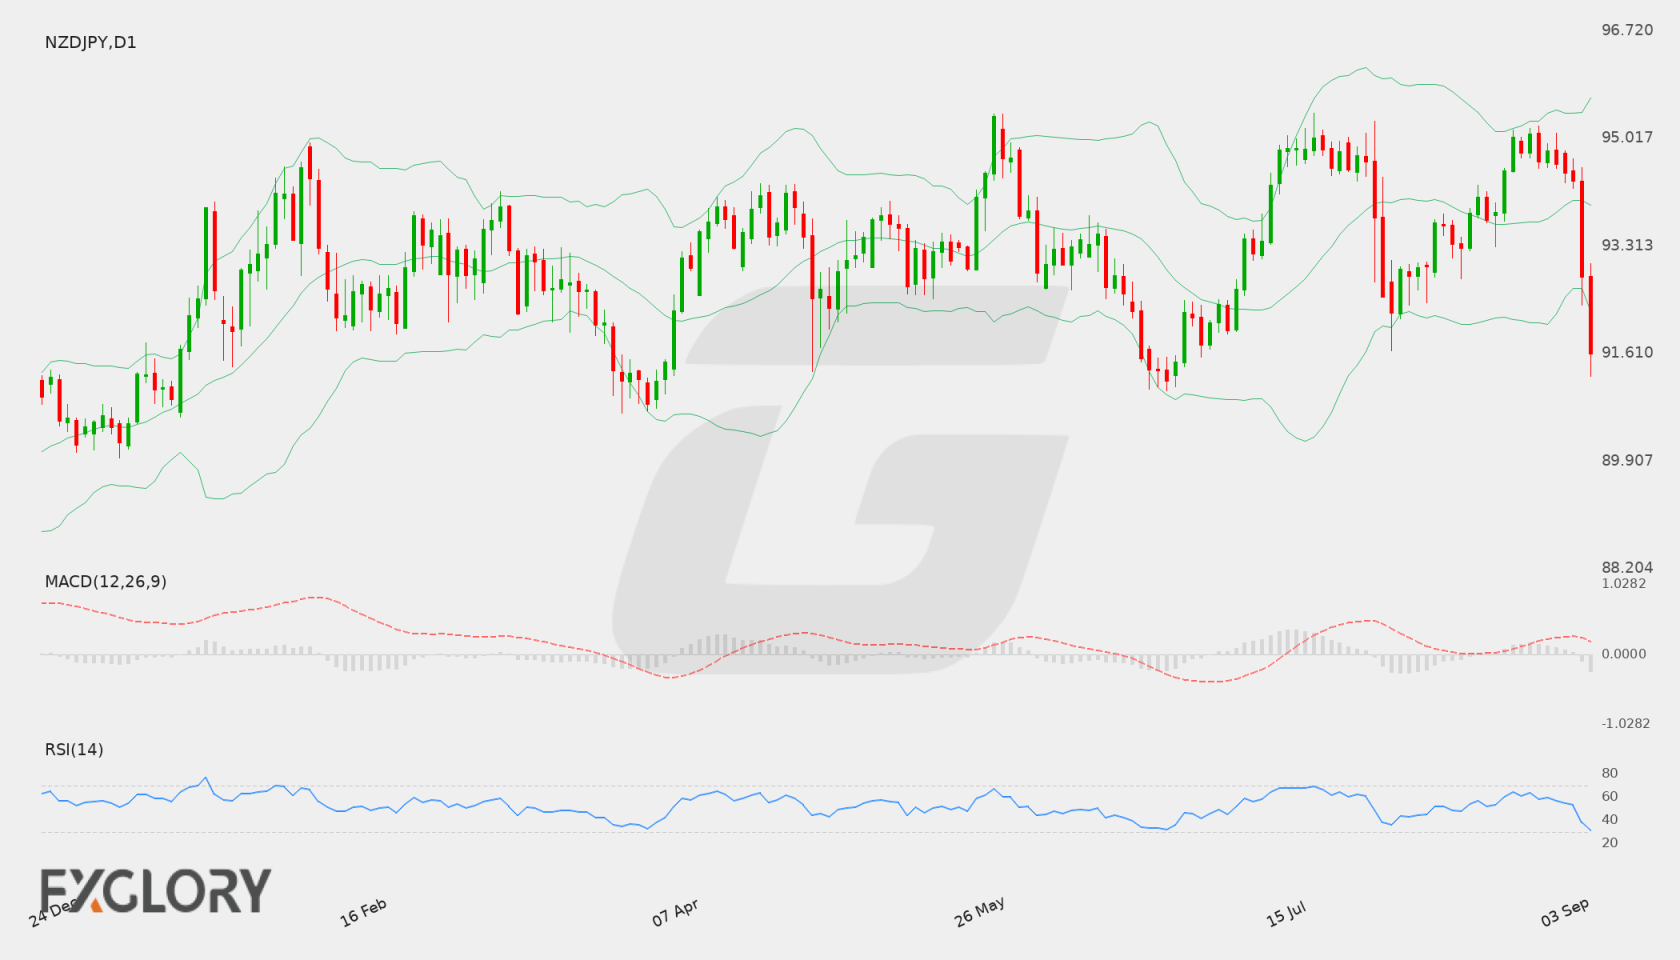
The daily chart highlights a sharp downward wave for NZD/JPY, dropping from recent peaks above 95.00 down toward a close of 91.611. Consistent lower daily lows indicate strong selling interest on the D1 timeframe.
Key Technical Indicators:
Bollinger Bands: The middle Bollinger Band sits at 93.960, with the upper band at 95.653 and lower band at 92.267. The last close of 91.611 sits below the lower band, reflecting expanded volatility to the downside.
RSI: The 14-day RSI is currently at 30.75, approaching the oversold threshold of 30, which indicates intense selling pressure in recent sessions.
MACD: The MACD indicator registers a negative value of -0.0748, confirming that bearish momentum currently dominates the daily price movement.
Support and Resistance:
Key technical levels for NZD/JPY place daily support at 91.023 and daily resistance at 95.415.
News to Watch for NZDJPY This Week:
- GDP q/q: Reflects economic performance in New Zealand and can influence domestic rate expectations.
- BOJ Policy Rate: Determines the benchmark interest rate in Japan and drives direct interest in the yen.
- BOJ Press Conference: Delivers direct insights from central bank leadership regarding economic outlook and monetary policy.
- Monetary Policy Statement: Summarizes monetary policy decisions and provides economic guidance for Japan.
Weekly Outlook and Consideration:
NZD/JPY enters the week with significant downside momentum, trading below its lower Bollinger Band and approaching the 91.023 support zone. A sustained hold near support could invite a corrective pullback toward the middle Bollinger Band at 93.960. However, if selling pressure breaks support at 91.023, the pair may see further downside expansion. Traders should monitor upcoming economic updates and policy statements closely for directional drivers.
Disclaimer: The analysis provided for NZD/JPY is for informational purposes only and does not constitute investment advice. Traders are encouraged to perform their own analysis and research before making any trading decisions. Market conditions can change quickly, so staying informed with the latest data is essential.