
The daily trend is neutral and the close sits between the SMA200 and the EMA50, so the week turns on whether a completed D1 close can resolve the 11.04386 to 11.10736 range, with two ECB speaker appearances adding event-driven volatility risk.
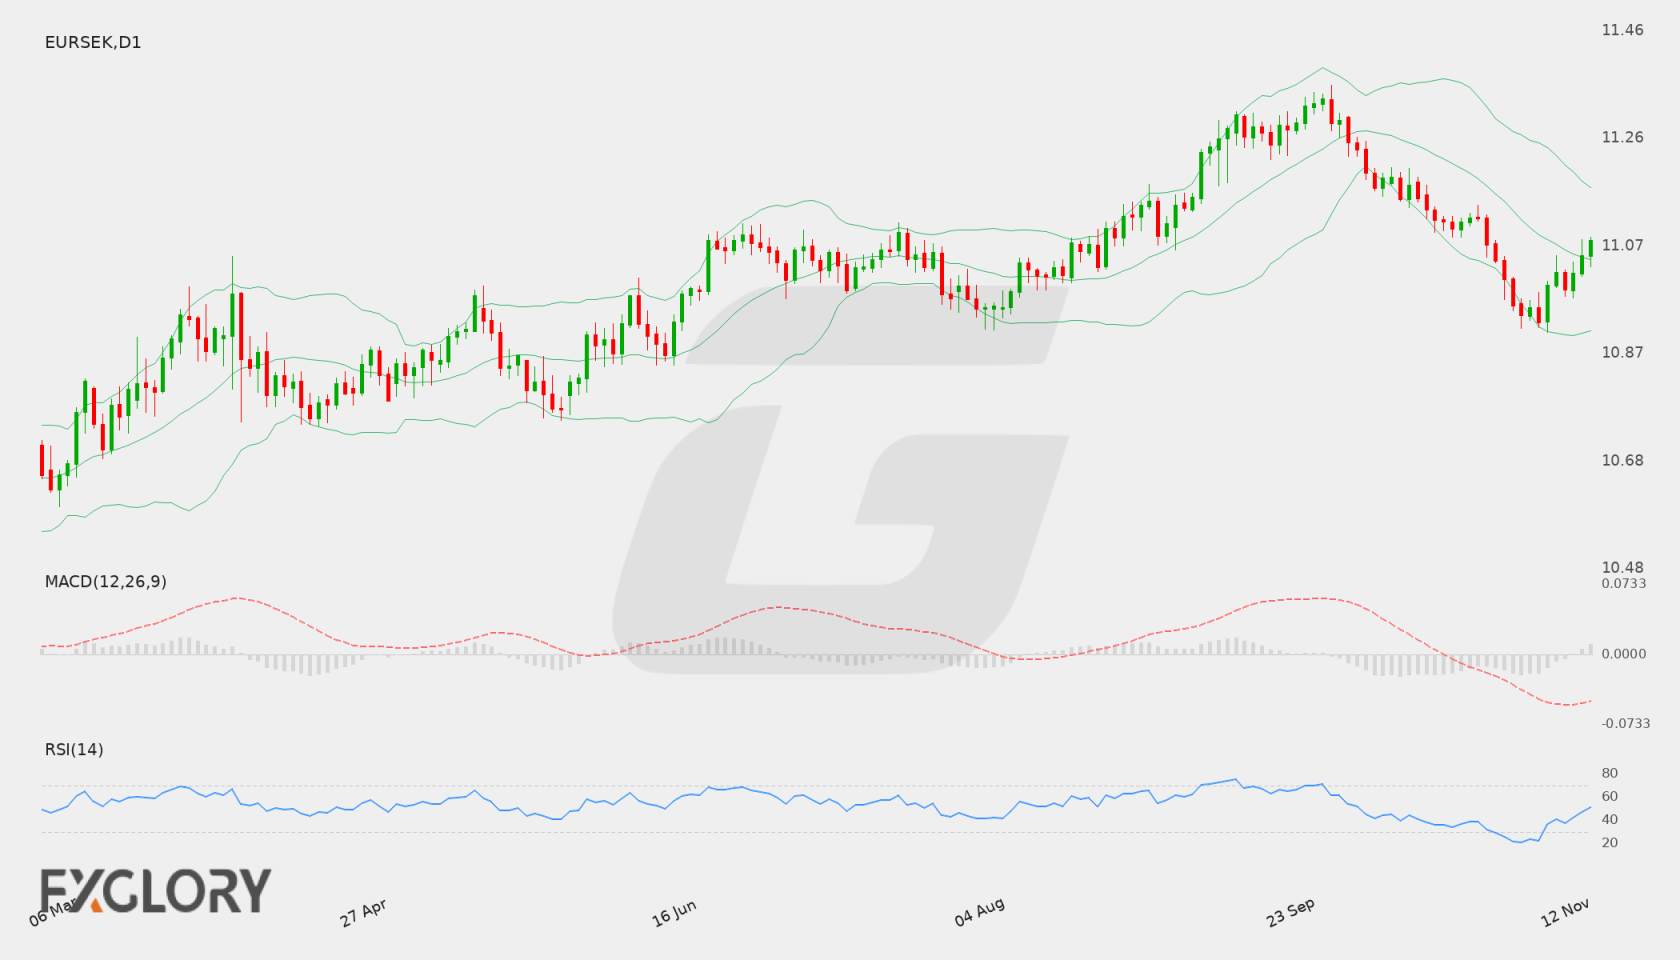
EUR/SEK Weekly Forecast at a Glance
In brief
Neutral bias for the week: D1 structure is mixed, with the close above EMA20 and SMA200 but below EMA50, while bullish H4 tactics offer only partial, timing-dependent support.
The weekly thesis is neutral because the daily chart has not yet produced a decisive structure. The last D1 close of 11.07763 is above the D1 EMA20 at 11.05255, the Bollinger middle at 11.04386 and the SMA200 at 10.95677, which keeps the longer-term picture supportive. The close remains below the EMA50 at 11.09753 and the primary resistance at 11.10736, however, and the EMA50 is sloping lower while the SMA200 slopes higher. That split between a falling medium-term average and a rising long-term average is why the forecast does not lean in either direction.
The H4 frame is bullish, and that matters for timing rather than for the weekly bias. The H4 close of 11.07763 is above the H4 EMA20 at 11.03961, the EMA50 at 11.02143 and the Bollinger middle at 11.03156, and H4 MACD sits above its signal with a positive histogram. The H4 close still trades below H4 resistance at 11.08006, so the tactical advantage has not yet carried into the daily resistance at 11.10736. Stable volatility on both frames describes an orderly environment rather than an expanding one, which fits a level-by-level development but does not establish direction.
- Bullish targets
-
- T111.14324
- T211.17436
- Bearish targets
-
- T111.00166
- T210.97295
- Invalidation
- One completed D1 close above 11.18557 or below 10.94556.
Selected key events
- ECB President Lagarde Speaks11 Nov 2026 12:45 GMT+3Medium
- ECB President Lagarde Speaks12 Nov 2026 22:30 GMT+3Medium
| Price at last update | 11.10121 as of 14 Nov 2026 02:50 GMT+3 |
|---|---|
| Completed D1 reference close | 11.07763 as of 12 November 2026 |
| Primary support | 11.04386 |
| Secondary support | 11.00166 |
| Primary resistance | 11.10736 |
| Bullish targets | 11.14324, 11.17436 |
| Bearish targets | 11.00166, 10.97295 |
| Formal weekly thesis invalidation | Upper 11.18557 — One completed D1 close above 11.18557 formally invalidates the neutral weekly thesis. Lower 10.94556 — One completed D1 close below 10.94556 formally invalidates the neutral weekly thesis. |
Live EUR/SEK Tools
A forecast is a snapshot. These pages keep moving with the market.
- Live
Live chart & price
Watch EUR/SEK move tick by tick. Flip from the 1-minute chart to the monthly, with trading conditions right alongside.
- Live
Technical signals
Buy, sell or sit it out? Oscillators, moving averages and pivot points boiled down to one clear reading, updated live.
Economic calendar
Know what's coming before it hits the price: every scheduled release with impact, forecast and actual.
Historical data
Open, high, low and close on any timeframe from 1 minute to monthly. Test your idea, then download the data.
All EUR/SEK forecasts
Every weekly outlook in one place. Scroll back to see how earlier calls played out against the chart.
EUR/SEK Fundamental Drivers This Week
Scheduled economic events relevant to EUR/SEK during 9–14 November 2026 include ECB President Lagarde Speaks, ECB President Lagarde Speaks. Directional impact depends on the released data relative to supplied expectations.
Scroll table sideways for more columns →
| Event | Scheduled | Importance |
|---|---|---|
| ECB President Lagarde Speaks | 11 Nov 2026 12:45 GMT+3 | Medium |
| ECB President Lagarde Speaks | 12 Nov 2026 22:30 GMT+3 | Medium |
Current EUR/SEK Price and Weekly Market Context
The weekly picture starts with D1 structure. The daily trend is neutral and the close sequence is mixed, so recent closes have not yet built a consistent directional path. D1 momentum is mixed as well: RSI at 50.94 is above 50 and MACD sits above its signal, but MACD remains below zero, so daily momentum is constructive relative to its signal without confirming a bullish regime. H4 provides the only clearly bullish reading, with the close above its moving averages and Bollinger middle, which supports the tactical picture while the daily structure remains unresolved. Stable volatility frames the environment as orderly rather than expanding.
- D1 trendneutralClose vs 50 EMA and 200 SMA
- H4 tacticalbullishH4 close vs 20 and 50 EMA
- MomentummixedRSI and MACD histogram
- VolatilitystableD1 ATR change
Is EUR/SEK Bullish or Bearish This Week?
The week is framed around one question: whether a completed D1 close can break out of the 11.04386 to 11.10736 range. The bullish path depends on a completed D1 close above primary resistance, the bearish path depends on a completed D1 close below primary support, and the base path involves two-sided trade inside the range while the daily structure stays mixed. Because the formal bias is neutral, these paths are alternatives rather than a forecast of which will occur.
Scenario 1 of 3Bullish continuation
- D1 confirmation
- One completed D1 close above primary resistance at 11.10736 would move the daily close above the level it currently sits below, opening the pathway toward the bullish targets at 11.14324 and 11.17436.
- H4 tactical signal
- An H4 close above H4 resistance at 11.08006 would show the bullish H4 state extending through tactical resistance and would provide early support for a daily attempt at 11.10736, although it would not replace the completed D1 close requirement.
- Targets
- 11.14324, 11.17436
- Scenario failure condition
- A completed D1 close back below 11.10736 after a bullish attempt, or an H4 close that falls back below 11.06263, would weaken the bullish path and return price to the mixed range structure.
Scenario 2 of 3Base / neutral
- D1 confirmation
- Completed D1 closes that remain between primary support at 11.04386 and primary resistance at 11.10736 would confirm the range-based base scenario while the close sequence stays mixed.
- H4 tactical signal
- H4 closes that move back and forth between H4 support at 11.06263 and H4 resistance at 11.08006 would show tactical hesitation without a clear directional resolution.
- Targets
- The reference range runs from primary support at 11.04386 to primary resistance at 11.10736, with secondary support at 11.00166 and secondary resistance at 11.14324 serving as the wider reference boundaries if the range is exited.
- Scenario failure condition
- A completed D1 close above 11.10736 or below 11.04386 would move the scenario out of its range framing and into the bullish or bearish path respectively.
Scenario 3 of 3Bearish reversal
- D1 confirmation
- One completed D1 close below primary support at 11.04386 would move the daily close beneath a level it currently holds above, opening the pathway toward the bearish targets at 11.00166 and 10.97295.
- H4 tactical signal
- An H4 close below H4 support at 11.06263 would turn the tactical picture against the bullish H4 state and add early pressure toward daily support at 11.04386, while still requiring a completed D1 close for structural confirmation.
- Targets
- 11.00166, 10.97295
- Scenario failure condition
- An H4 recovery above 11.08006 followed by a completed D1 close back above 11.04386 would weaken the bearish path and restore the range framing.
EUR/SEK D1 Outlook and H4 Technical Triggers
The daily timeframe controls the weekly thesis. H4 evidence is used only for earlier confirmation, tactical warning and scenario-failure context. Complete live H4, H1 and intraday readings remain on the Technical page.
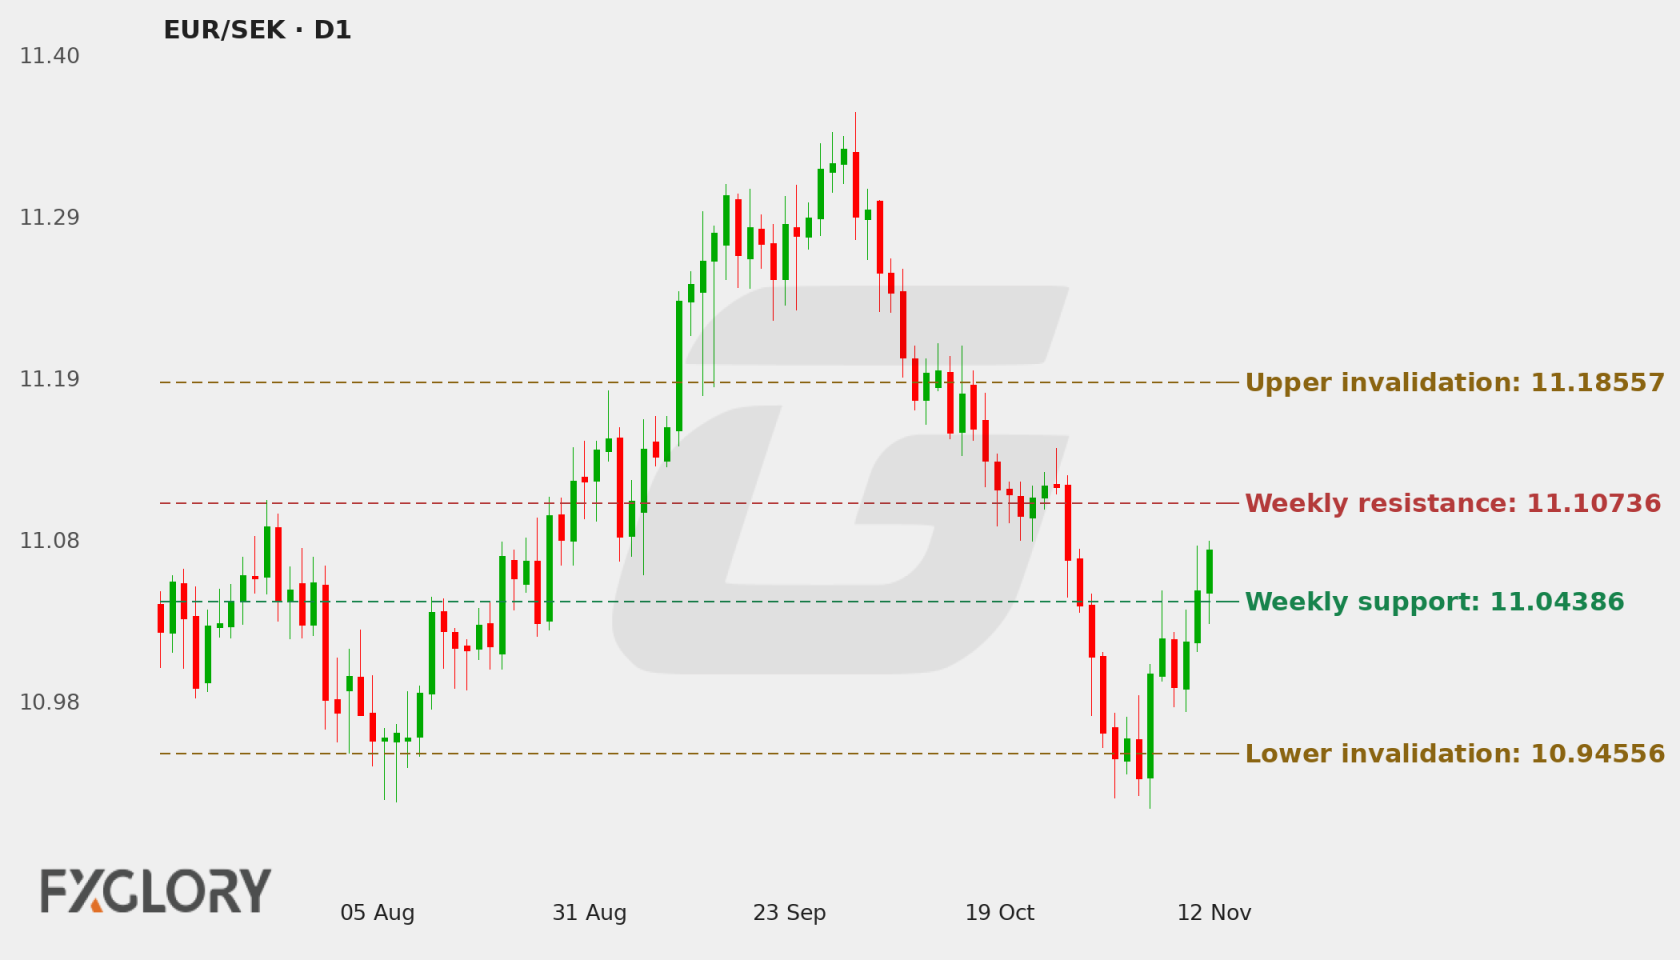
D1 Price Action and Market Structure
The last D1 close of 11.07763 sits above the EMA20 at 11.05255, the SMA200 at 10.95677 and the Bollinger middle at 11.04386, but below the EMA50 at 11.09753. Against the level framework, the close is above primary support at 11.04386 and below primary resistance at 11.10736, which places it inside the range that defines the base scenario. The Bollinger middle shares its value with primary support, so the volatility envelope and the structural level agree on the lower edge of the range, although the formal reference remains the structural level. The close sequence is mixed, meaning recent closes have not produced a consistent progression toward either side.
H4 Tactical Triggers
H4 supplies the bullish tactical reading, and the readings are internally consistent. The H4 close of 11.07763, which matches the D1 reference close, sits above the H4 EMA20 at 11.03961, the EMA50 at 11.02143 and the Bollinger middle at 11.03156, with H4 MACD above its signal and a positive histogram. H4 RSI at 68.26 is above 50 and stronger than the D1 RSI of 50.94, so tactical momentum is more advanced than the daily. The limiting factor is that the H4 close remains below H4 resistance at 11.08006, so the tactical strength has not yet reached the daily primary resistance at 11.10736. H4 therefore works as an early warning and timing layer that confirms the short-term upward lean without controlling the weekly thesis.
Technical Indicators at a Glance
Automated technical summary
Automated readings place D1 in a neutral trend state with mixed momentum and stable volatility, while H4 reads bullish across trend and momentum. The tension between the two frames is the central technical feature of the week: daily structure remains balanced while the tactical frame leans higher within the supplied level framework.
Selected snapshot: D1 with H4 tactical context. Updated 14 November 2026.
- RSI50.94Neutral
- MACDAbove signalBullish
- Bollinger Bands63% of bandUpper half
- Moving averagesBetweenNeutral
- ATR560.7 pipsStable
RSI (14)
Neutral
H4 68.26
D1 RSI at 50.94 sits just above the midline, so daily momentum is slightly positive rather than decisively bullish, which is consistent with the neutral D1 trend. H4 RSI at 68.26 is more pronounced and shows that tactical momentum is stronger than the daily reading. That gap supports H4 as timing context rather than as the controlling thesis.
- D1 RSI
- 50.94
- H4 RSI
- 68.26
MACD (12, 26, 9)
Bullish momentum
D1 MACD is above its signal line even though both lines remain below zero, and the positive histogram confirms that relationship. Daily momentum is therefore positive relative to its signal but not yet positive in absolute terms, which is why the momentum state is mixed. H4 MACD is above its signal with a positive histogram, so tactical momentum aligns with the bullish H4 state and does not conflict with it.
- MACD
- -0.038423
- Signal
- -0.049141
- Histogram
- 0.010718
Bollinger Bands (20, 2σ)
Upper half
Striped ends = price outside the bands.
The D1 close is above the Bollinger middle at 11.04386 and below the upper band at 11.17436, so price sits in the upper portion of the band structure rather than at an extreme. The band readings fit the stable volatility state and do not suggest an expansion phase. On H4, the close is above the middle band at 11.03156 and below the upper band at 11.09303, which keeps tactical price inside the envelope while it approaches H4 resistance.
- Position in band
- 63%
- Band width
- 2610.0 pips (2.36%)
Moving averages (D1)
Neutral structure
- 50 EMA falling11.09753Price is 199.0 pips below (-0.18%)
- 200 SMA rising10.95677Price is 1208.6 pips above (+1.10%)
The D1 moving averages describe a mixed trend. The close is above the EMA20 at 11.05255 and the SMA200 at 10.95677, which keeps the short- and long-term readings supportive, but it remains below the EMA50 at 11.09753. The EMA50 is sloping lower while the SMA200 slopes higher, so the medium-term average has lost upward slope even as the long-term average still rises. The EMA50 sits above the close and below primary resistance at 11.10736, making it an overhead reference that the daily close must clear. On H4, the close is above both the EMA20 and EMA50, consistent with the bullish tactical state, and both averages sit below H4 resistance at 11.08006.
- D1 close
- 11.07763
- 50 EMA
- 11.09753
- 200 SMA
- 10.95677
ATR (14)
Stable volatility
One ATR either side of the latest close. A measure of move size, not a price target.
D1 ATR of 0.05607 and H4 ATR of 0.02007 describe the typical movement of each timeframe, and the stable volatility state indicates that neither frame is currently expanding. A stable reading points toward measured level tests rather than rapid breakouts, but it does not indicate direction. The D1 ATR also gives a sense of scale for judging how far a completed daily close would need to travel beyond the primary levels.
- D1 ATR
- 0.05607 (0.51%)
- H4 ATR
- 0.02007 (0.18%)
Technical conclusion: The D1 thesis is neutral: the daily trend and mixed close sequence leave the controlling structure unresolved while the close sits inside the 11.04386 to 11.10736 range. The strongest supporting evidence is the close above the EMA20, SMA200 and Bollinger middle together with D1 MACD above its signal, which keeps the daily picture from tilting bearish. The strongest counterargument is that the close remains below the EMA50 and primary resistance, and the falling EMA50 limits upside conviction. H4 supports the short-term upward case but still sits below H4 resistance at 11.08006, so it acts as a warning and timing signal rather than as confirmation. The levels that matter next are primary resistance at 11.10736 for bullish development and primary support at 11.04386 for bearish development, with secondary levels coming into play only after those are resolved on a completed D1 close.
View all live EUR/SEK oscillators, moving averages, pivot points and timeframe signals.
EUR/SEK Weekly Support, Resistance and Invalidation
| Level | Role | Timeframe | Why it matters |
|---|---|---|---|
| 11.04386 | Primary support | D1 | Nearest structural floor below the close. The bearish path requires a completed D1 close below it, and it coincides with the Bollinger middle. |
| 11.00166 | Secondary support | D1 | Next structural floor if primary support gives way on a completed daily close, and a bearish target reference. |
| 10.97295 | Third support candidate | D1 | Deeper structural reference below the secondary support and the outer bearish target. |
| 11.10736 | Primary resistance | D1 | Overhead structural ceiling. A completed D1 close above it opens the bullish path. |
| 11.14324 | Secondary resistance | D1 | First bullish reference target above primary resistance. |
| 11.17436 | Third resistance candidate | D1 | Upper structural candidate and the outer bullish reference target. |
| 11.06263 | H4 support | H4 | Tactical floor. An H4 close below it shifts short-term pressure toward daily support. |
| 11.08006 | H4 resistance | H4 | Tactical ceiling. An H4 close above it is the main short-term bullish trigger. |
These are forecast-specific market-structure levels. Formula-based Classic, Fibonacci and Camarilla pivots remain on the Technical page.
Economic News & Events to Watch for EUR/SEK This Week
Selected events may increase EUR/SEK volatility. Direction depends on the released value relative to consensus and previous results.
Scroll table sideways for more columns →
| Event | Date and time | Importance | Previous | Consensus |
|---|---|---|---|---|
| ECB President Lagarde Speaks | 11 Nov 2026 12:45 GMT+3 | Medium | — | — |
| ECB President Lagarde Speaks | 12 Nov 2026 22:30 GMT+3 | Medium | — | — |
Calendar source: FXGlory economic calendar. Retrieved 13 Nov 2026 04:16 GMT+3. View the complete EUR/SEK economic calendar.
EUR/SEK Outlook for 9–14 November 2026
The weekly forecast remains Neutral because the D1 trend is neutral, the close sequence is mixed and momentum is mixed, even though the close holds above several key D1 averages and the H4 tactical state is bullish. The essential question for the week is whether a completed D1 close can move beyond primary resistance at 11.10736 or primary support at 11.04386, which together define the working range.
The two ECB speaker appearances add timing pressure rather than a directional signal, and stable volatility points to a measured rather than explosive environment. The bullish and bearish paths should be read as conditional scenarios that depend on completed D1 closes, with the H4 triggers serving as early warning and timing context only.
Weekly Forecast Risks and What Would Change the Outlook
- Timeframe disagreement: D1 is neutral with mixed momentum while H4 is bullish with RSI at 68.26. Tactical strength may not carry into a daily close beyond 11.10736.
- Falling EMA50 overhead: The D1 close sits below the EMA50 at 11.09753, which lies below primary resistance. A failure to clear that area would keep the daily trend capped.
- Event-driven repricing at range edges: Two ECB speaker appearances could produce volatility spikes near 11.04386 and 11.10736 without a predetermined direction, creating whipsaw risk around the range boundaries.
Formal weekly invalidation: The neutral weekly thesis is formally invalidated by one completed D1 close above 11.18557 or below 10.94556.
EUR/SEK Weekly Forecast FAQs
Is EUR/SEK bullish or bearish this week?
The forecast bias is Neutral. The D1 trend state is neutral, the close sequence is mixed and D1 momentum is mixed, so the daily framework does not yet favor either side. The bullish H4 state is a tactical reading and is not enough on its own to change the weekly bias.
What scenario would strengthen for EUR/SEK this week?
The base case is a range between primary support at 11.04386 and primary resistance at 11.10736 while the D1 structure resolves. Movement toward the bullish targets at 11.14324 and 11.17436 would first require a completed D1 close above 11.10736, and movement toward the bearish targets at 11.00166 and 10.97295 would first require a completed D1 close below 11.04386.
What are the key EUR/SEK support and resistance levels?
Primary support is 11.04386 and secondary support is 11.00166. Primary resistance is 11.10736 and secondary resistance is 11.14324. The H4 reference levels are 11.06263 for support and 11.08006 for resistance, and they govern tactical timing rather than the weekly thesis.
What would invalidate this EUR/SEK forecast?
The neutral weekly thesis is formally invalidated by one completed D1 close above 11.18557 or below 10.94556.
Methodology, Data and Sources
- Price-data source: FXGlory price feed (EURSEK)
- Live quote timestamp: 14 Nov 2026 02:50 GMT+3
- Weekly analysis timestamp: 9 November 2026
- Chart timestamp: 14 November 2026 (redrawn daily)
- Daily check: Every day at 04:00 GMT+3: the latest completed D1 close is checked against the invalidation levels and the chart is redrawn.
- Technical snapshot timestamp: 9 November 2026
- Calendar-data source: FXGlory economic calendar
- Calendar retrieval timestamp: 13 Nov 2026 04:16 GMT+3
- Candle convention: FXGlory D1 and H4 candles; D1 candle dates are evaluated in UTC and invalidation uses completed D1 closes only.
- Indicator settings: D1 RSI(14), MACD(12,26,9), Bollinger Bands(20,2), EMA(50), SMA(200), ATR(14); H4 RSI/MACD/Bollinger/EMA/ATR.
- Level-selection method: Weekly D1 support/resistance levels are structural market levels. Formal invalidation uses a hard 0.75× D1 ATR(14) minimum anchor distance plus a 0.20× D1 ATR(14) outward buffer; H4 levels are tactical only.
- Weekly forecast method: D1 controls the weekly thesis; H4 supplies tactical confirmation/warning only.