
USDSGD Forecast

USD iconSGD icon
USD/SGD

US Dollar vs Singapore Dollar

USD/SGD Live Price

1.27583
+0.01%

USD/SGD Forecast — 20 September 2026

Time Zone: GMT +3

Time Frame: Daily (D1) / Weekly Outlook

Weekly Fundamental Overview:

The fundamental drivers for USD/SGD (USDSGD) over the coming week center on key macroeconomic indicators from the United States. Important figures covering growth, inflation, and employment will provide market participants with fresh insights into economic conditions and future monetary policy expectations, which could influence overall US Dollar dynamics.

Price Action:

USD/SGD (USDSGD) recorded a recent daily close at 1.27444. Price action on the daily chart reflects a recovery from recent swing lows near 1.26300, advancing toward a high of 1.27631 before stabilizing near current price levels.

Key Technical Indicators:

Bollinger Bands: The Daily Bollinger Bands display a middle band at 1.26895, an upper band at 1.27588, and a lower band at 1.26202. Trading at 1.27444, USD/SGD is positioned above the middle band and is testing the upper boundary of the indicator.

RSI: The 14-period Daily Relative Strength Index (RSI) is registered at 54.51. This places the indicator in neutral territory just above the 50 level, indicating balanced momentum with a mild upward slant.

MACD: The Daily MACD indicator currently stands at -0.001508. The negative reading shows that longer-term underlying momentum has been subdued, though recent price gains reflect short-term upward stabilization.

Support and Resistance:

Identified technical key levels for USD/SGD include primary support at 1.26171 and major resistance at 1.29634.

News to Watch for USDSGD This Week:

  • CB Consumer Confidence: Tracks consumer sentiment regarding economic activity and financial security.
  • JOLTS Job Openings: Measures the total number of open positions to gauge labor market strength.
  • ADP Non-Farm Employment Change: Highlights private sector employment shifts ahead of official labor metrics.
  • Core PCE Price Index m/m: Reflects underlying price inflation trends monitored by monetary policy makers.
  • Final GDP q/q: Confirms the overall rate of quarterly economic growth in the US economy.
  • ISM Manufacturing PMI: Assesses activity levels and operating conditions within the manufacturing sector.
  • Average Hourly Earnings m/m: Measures wage growth growth which influences consumer spending and inflation.
  • Non-Farm Employment Change: Details net monthly job creation across non-agricultural sectors.
  • Unemployment Rate: Reports the percentage of the active labor force that remains without employment.

Weekly Outlook and Consideration:

USD/SGD (USDSGD) approaches the trading week holding around the 1.27444 mark. Technical indicators show a neutral-to-bullish picture, with the RSI at 54.51 and price action trading near the upper Bollinger Band of 1.27588. A push higher may lead price toward key resistance at 1.29634, while a shift in sentiment could direct price back toward support at 1.26171. Market momentum will be influenced by incoming US macroeconomic data releases.

Disclaimer: The analysis provided for USD/SGD is for informational purposes only and does not constitute investment advice. Traders are encouraged to perform their own analysis and research before making any trading decisions. Market conditions can change quickly, so staying informed with the latest data is essential.
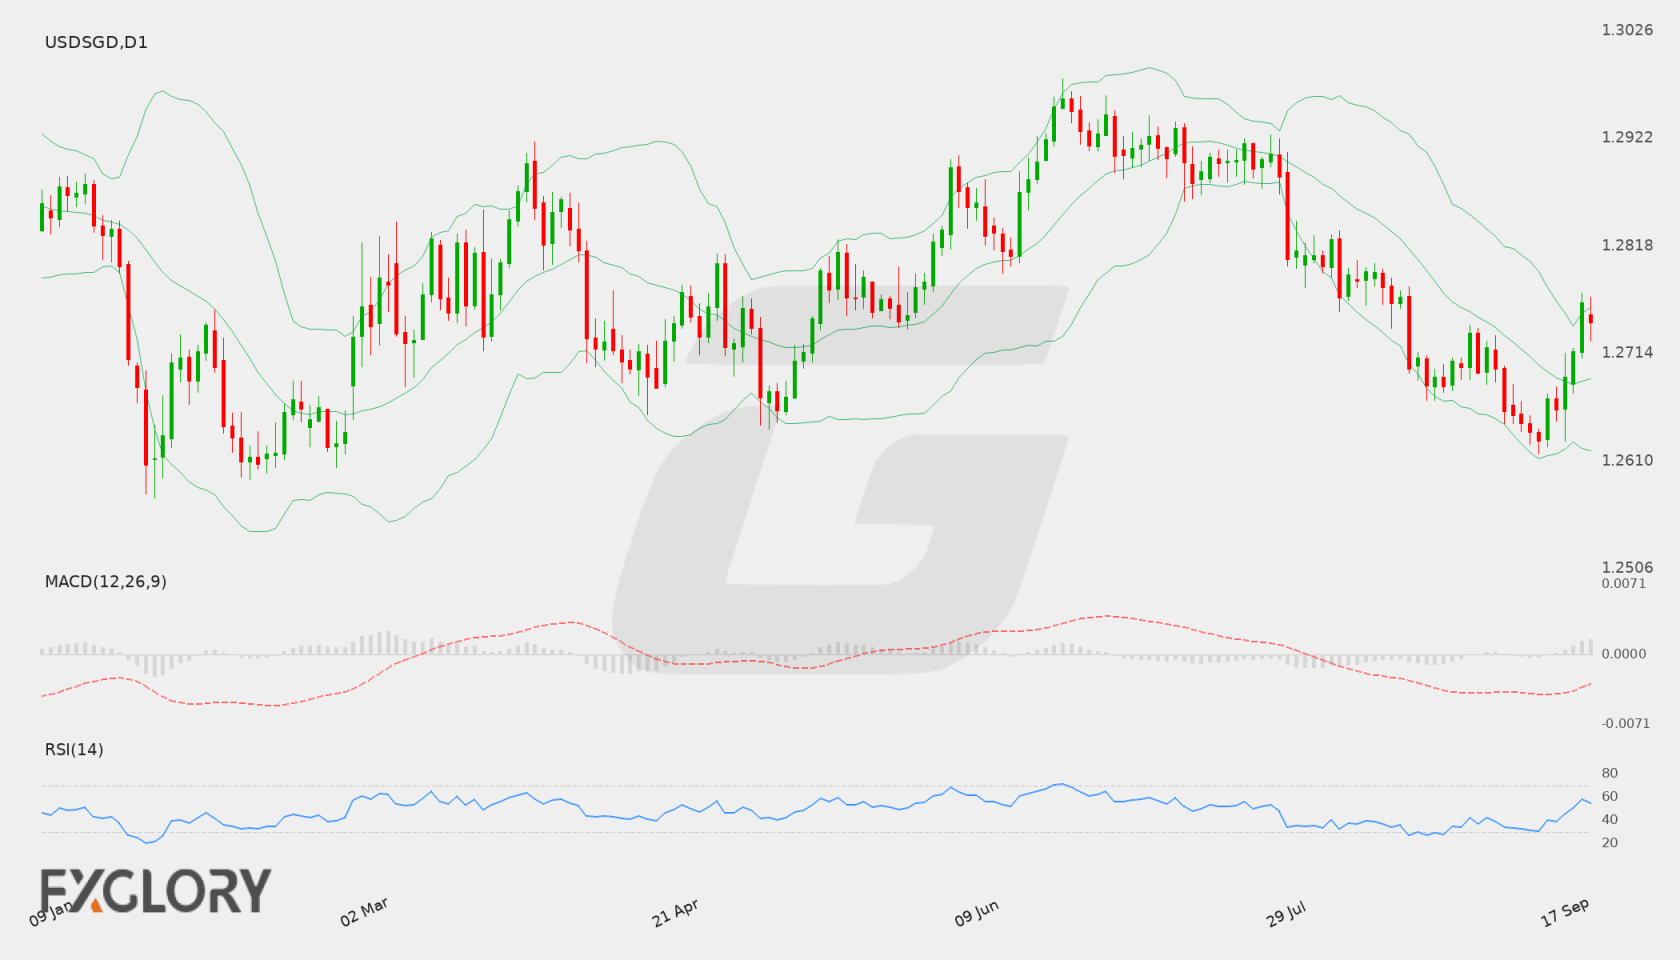
USD/SGD D1 technical analysis chart
USD/SGD D1 Technical Analysis for 09.20.2026

USD/SGD Forecast — 12 September 2026

Time Zone: GMT +3

Time Frame: Daily (D1) / Weekly Outlook

Weekly Fundamental Overview:

The USD/SGD pair continues to react to broader macroeconomic conditions affecting the US dollar and regional trade dynamics. Upcoming US economic releases, particularly decisions from the Federal Reserve regarding interest rates and economic growth forecasts, could trigger notable volatility for USDSGD during the week.

Price Action:

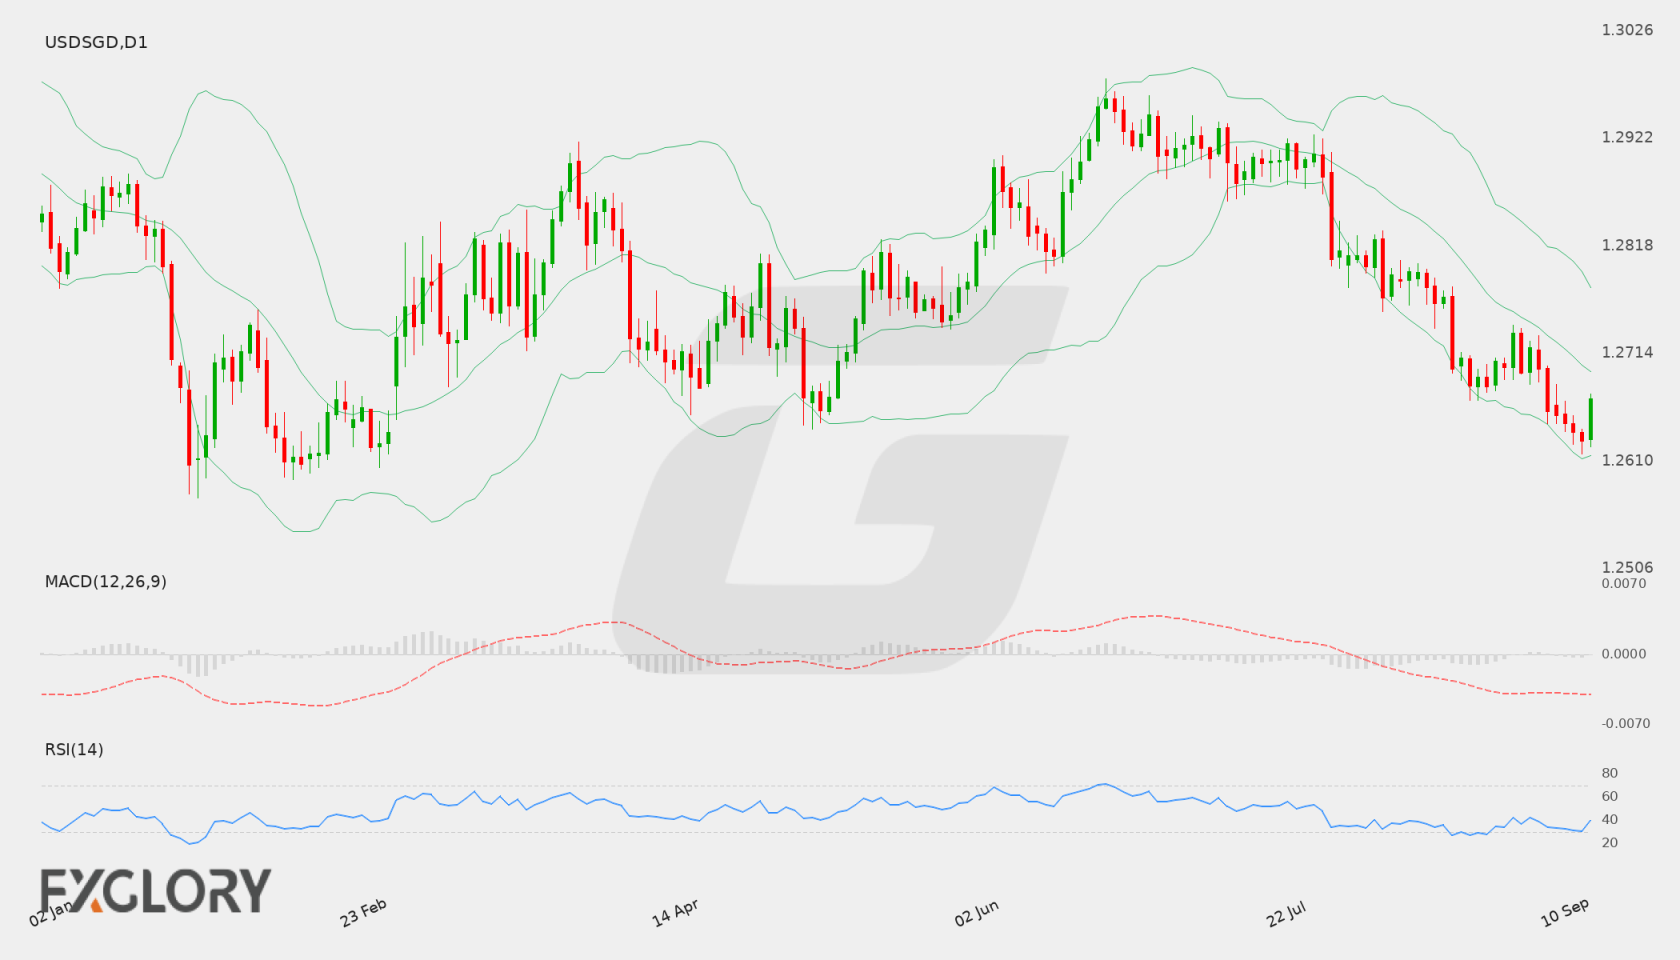
On the Daily (D1) timeframe, USD/SGD recently closed at 1.26701, recovering slightly after touching a low near 1.26300. The pair has experienced a persistent downtrend from recent peaks above 1.2900, remaining constrained below key dynamic resistance levels.

Key Technical Indicators:

Bollinger Bands: The Bollinger Bands indicator shows the middle band at 1.26968, acting as immediate overhead resistance. The upper band rests at 1.27783 while the lower band sits at 1.26153, indicating that price action is trading in the lower half of the band structure.

RSI: The 14-day Relative Strength Index (RSI) is recorded at 40.32, maintaining a position below the neutral 50 level. This signals prevailing weakness without yet breaching into deeply oversold territory.

MACD: The MACD indicator stands at -0.00412, remaining below the zero line. This negative reading reflects sustained downside momentum for USDSGD, though traders continue to watch for potential convergence signals.

Support and Resistance:

Immediate key support for USD/SGD is located around 1.26171, closely aligned with the lower Bollinger Band. On the upside, main resistance is identified at 1.29797, with intermediate resistance near the middle Bollinger band at 1.26968.

News to Watch for USDSGD This Week:

  • Core Retail Sales m/m: This release measures consumer spending shifts which may influence US dollar momentum.
  • Retail Sales m/m: Key consumer data can provide insights into overall economic activity affecting USD/SGD.
  • FOMC Economic Projections: Updated projections offer potential signals regarding future monetary policy paths.
  • FOMC Statement: Official policy statements can heavily impact market sentiment and exchange rate directions.
  • Federal Funds Rate: The interest rate decision remains a primary catalyst for USD volatility.
  • FOMC Press Conference: Executive commentary following the policy decision often drives sharp intraday moves.
  • Unemployment Claims: Weekly labor market data offers fresh evidence of economic strength or weakness.

Weekly Outlook and Consideration:

The technical outlook for USD/SGD remains weighted to the downside as daily indicators like RSI and MACD stay depressed below neutral thresholds. Trading below the middle Bollinger band at 1.26968 keeps the focus on key support around 1.26171. However, major US economic announcements could alter short-term market direction, making risk management crucial if resistance at 1.29797 is tested.

Disclaimer: The analysis provided for USD/SGD is for informational purposes only and does not constitute investment advice. Traders are encouraged to perform their own analysis and research before making any trading decisions. Market conditions can change quickly, so staying informed with the latest data is essential.
USD/SGD D1 technical analysis chart
USD/SGD D1 Technical Analysis for 09.12.2026

USD/SGD Forecast — 5 September 2026

Time Zone: GMT +3

Time Frame: Daily (D1) / Weekly Outlook

Weekly Fundamental Overview:

USD/SGD price action continues to be heavily influenced by broader macroeconomic conditions in the United States and global risk sentiment. Expectations around federal monetary policy and key upcoming US inflation updates remain central drivers for directional momentum in the pair.

Price Action:

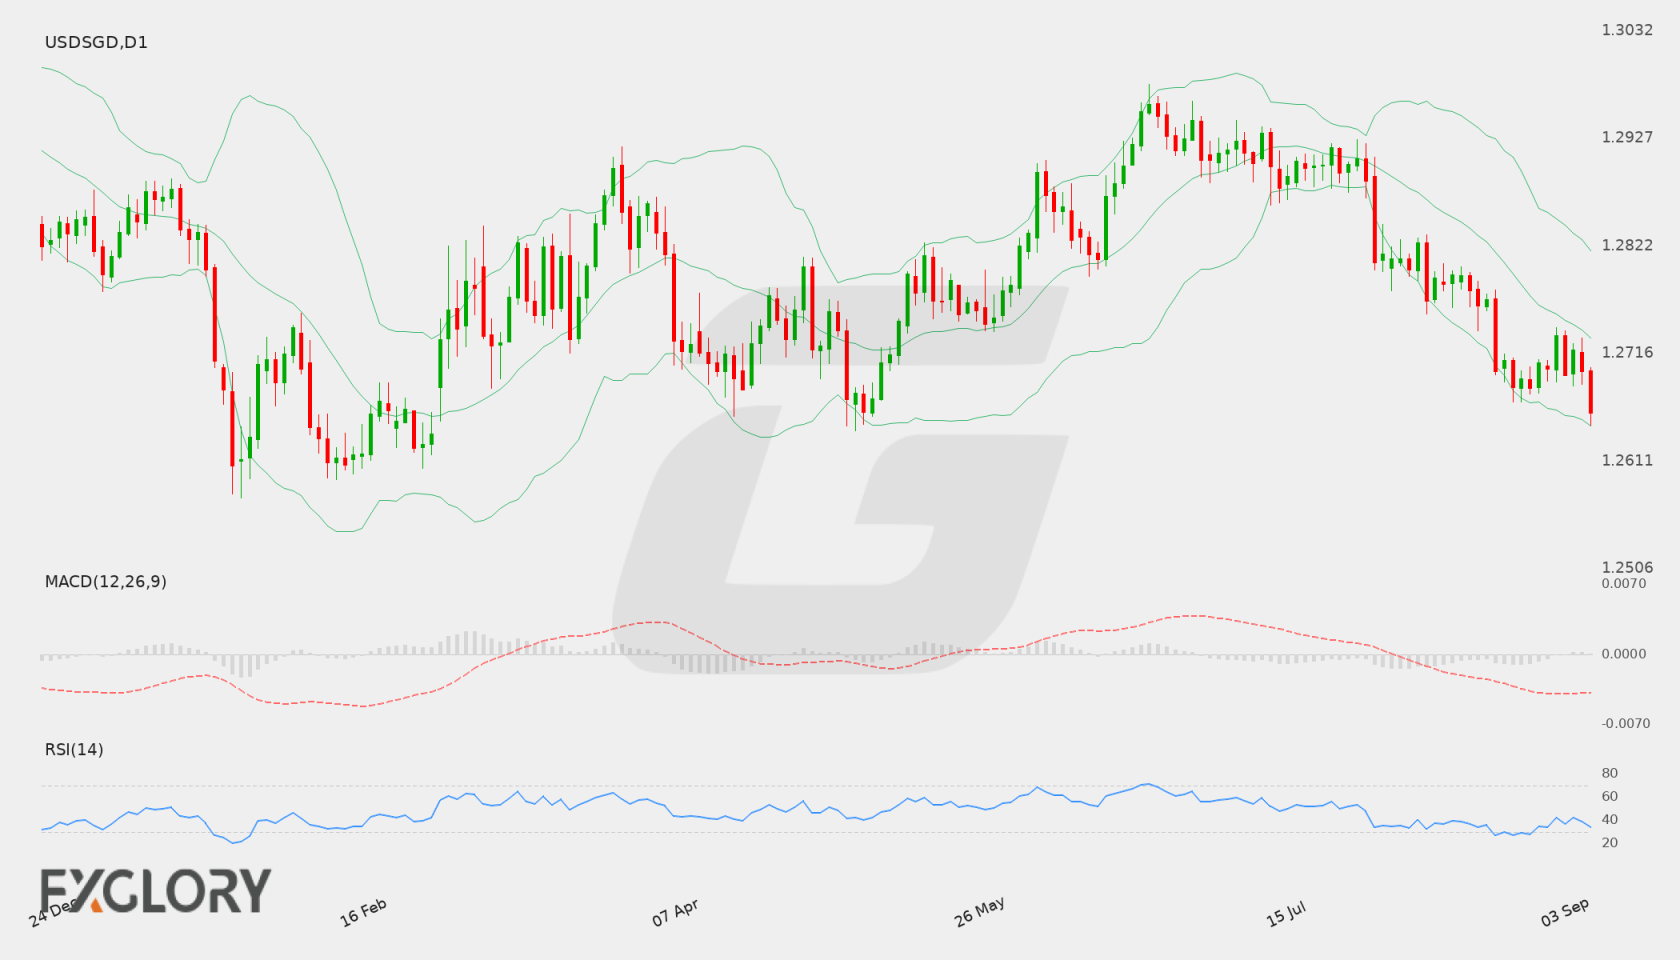
On the daily chart, USD/SGD has shown a steady downward trajectory over recent sessions, with the latest daily close at 1.26589. The pair has pressed lower from previous consolidated levels, signaling strong selling pressure as price action trades near recent multi-session lows.

Key Technical Indicators:

Bollinger Bands: The Bollinger Bands display a middle boundary at 1.27313, an upper band at 1.28171, and a lower band at 1.26454. With the last close sitting at 1.26589, spot price is hugging the lower band, reflecting heightened downside volatility and persistent bearish momentum.

RSI: The 14-period Relative Strength Index (RSI) stands at 33.58. This reading places the indicator near oversold territory, reflecting weak bullish momentum and potential exhaustion if downside pressure diminishes.

MACD: The daily MACD indicator is currently recorded at -0.00386, remaining below the zero signal line. This negative value indicates that short-term momentum continues to favor sellers relative to longer-term trends.

Support and Resistance:

Key technical levels for USD/SGD highlight immediate daily support near 1.26461. On the upside, major resistance is located at 1.29797, with intermediate resistance aligned near the middle Bollinger Band at 1.27313.

News to Watch for USDSGD This Week:

  • PPI m/m: This release measures wholesale price trends that can signal broader inflation pressures impacting interest rate expectations.
  • Core PPI m/m: Excludes volatile food and energy costs to provide a clearer signal on underlying producer inflation.
  • Unemployment Claims: Offers a weekly gauge of labor market resilience that influences overall economic outlooks.
  • Core CPI m/m: Tracks underlying monthly consumer price shifts that heavily influence monetary policy projections.
  • CPI y/y: Highlights headline annual inflation trends that shape market sentiment regarding economic health.
  • Core CPI y/y: Measures persistent annual consumer price changes crucial for evaluating long-term monetary policy.
  • CPI m/m: Details short-term consumer price movements that can alter immediate rate forecasts.
  • Prelim UoM Inflation Expectations: Reflects consumer outlooks on future price trends which influence economic expectations.
  • Prelim UoM Consumer Sentiment: Indicates overall consumer confidence levels that impact broader market risk sentiment.

Weekly Outlook and Consideration:

USD/SGD heads into the week under prevailing bearish momentum, with price action hovering near key lower technical boundaries. Daily indicators such as the negative MACD and an RSI near oversold levels underscore current weakness. A break below immediate support at 1.26461 could extend downside pressure, while a rebound would need to overcome resistance at 1.27313 and 1.29797 to establish neutral ground. Market dynamics will likely be shaped by incoming US economic data.

Disclaimer: The analysis provided for USD/SGD is for informational purposes only and does not constitute investment advice. Traders are encouraged to perform their own analysis and research before making any trading decisions. Market conditions can change quickly, so staying informed with the latest data is essential.
USD/SGD D1 technical analysis chart
USD/SGD D1 Technical Analysis for 09.05.2026

USD/SGD Forecast — 29 August 2026

Time Zone: GMT +3

Time Frame: Daily (D1) / Weekly Outlook

Weekly Fundamental Overview:

The USD/SGD currency pair remains sensitive to broader US economic signals and Federal Reserve policy expectations. Upcoming US labor and manufacturing data releases could influence US Dollar strength relative to the Singapore Dollar, steering pair sentiment throughout the trading week.

Price Action:

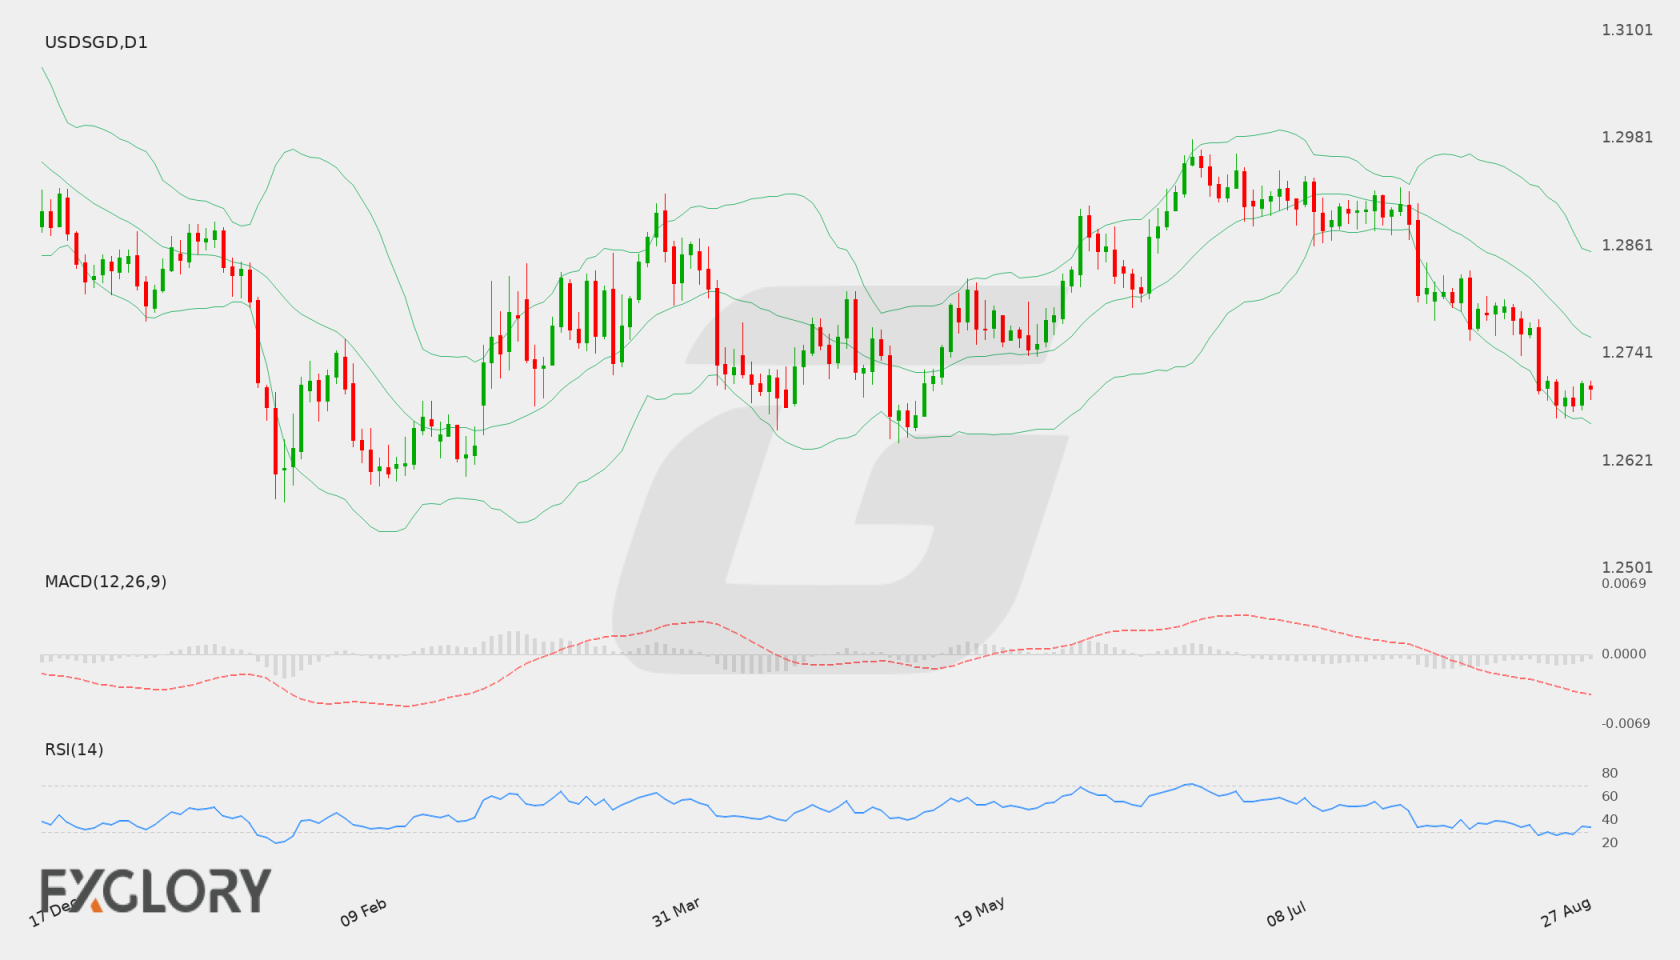
On the daily (D1) chart, USD/SGD has experienced continuous selling pressure over recent sessions, dropping from levels above 1.2900 down to a recent close of 1.27014. The recent daily candles reflect lower highs and lower lows, pointing to prevailing short-term weakness.

Key Technical Indicators:

Bollinger Bands: USD/SGD is hovering close to the lower Bollinger Band at 1.2662, well below the middle band of 1.2759. The upper band is positioned at 1.2855, indicating that the price is currently compressed near the lower end of its volatility channel.

RSI: The 14-day Relative Strength Index (RSI) stands at 33.80. Positioning near oversold territory suggests ongoing seller control, though it may also indicate potential for consolidation if selling momentum wanes.

MACD: The MACD indicator registers at -0.0044, remaining below the zero line. This negative reading signals sustained bearish momentum across the daily timeframe.

Support and Resistance:

Key technical levels for USDSGD show immediate support around 1.26686. On the upside, resistance is identified near 1.29797, which serves as a major barrier for any rebound efforts.

News to Watch for USDSGD This Week:

  • ISM Manufacturing PMI: Measures manufacturing sector expansion or contraction, influencing US Dollar sentiment.
  • JOLTS Job Openings: Indicates US labor market demand and hiring activity strength.
  • ISM Manufacturing Prices: Tracks price changes paid by manufacturers, reflecting inflationary trends.
  • ADP Non-Farm Employment Change: Acts as a preliminary gauge for private sector employment growth in the US.
  • ISM Services PMI: Evaluates activity in the service sector, providing clues on broader US economic growth.
  • Non-Farm Employment Change: Serves as a critical report on overall US payroll additions and labor strength.
  • Unemployment Rate: Provides the percentage of unemployed workforce, heavily impacting Fed policy expectations.
  • Average Hourly Earnings m/m: Measures wage inflation pressures that affect underlying consumer price trends.

Weekly Outlook and Consideration:

The weekly outlook for USD/SGD leans defensive following its decline to 1.27014. Should the price breach the primary support at 1.26686, extended downside movements could develop. Conversely, if buyers defend support and lift the pair above the middle Bollinger Band at 1.2759, a retest towards resistance at 1.29797 could emerge. Market participants should monitor incoming US economic releases for potential directional catalysts.

Disclaimer: The analysis provided for USD/SGD is for informational purposes only and does not constitute investment advice. Traders are encouraged to perform their own analysis and research before making any trading decisions. Market conditions can change quickly, so staying informed with the latest data is essential.

USD/SGD D1 technical analysis chart
USD/SGD D1 Technical Analysis for 08.29.2026

USD/SGD Forecast — 22 August 2026

Time Zone: GMT +3

Time Frame: Daily (D1) / Weekly Outlook

Weekly Fundamental Overview:

The USD/SGD pair reflects ongoing shifts in macroeconomic conditions affecting the US dollar and broader risk sentiment in Asian markets. Traders are keeping a close watch on upcoming US economic releases to gauge interest rate trajectories, while local market dynamics continue to influence Singapore dollar flows.

Price Action:

On the daily (D1) chart, USD/SGD (USDSGD) has experienced downside pressure, retreating toward recent lower bounds and closing around 1.27098. The pair has shown consecutive lower daily closes after failing to sustain moves higher, reflecting dominant selling momentum in recent sessions.

Key Technical Indicators:

Bollinger Bands: The Bollinger Bands indicator shows a middle band at 1.28050, an upper band at 1.29152, and a lower band at 1.26948. Price action near the lower band at 1.27098 suggests heightened downside volatility, with potential for either a continuation along the lower band or a technical bounce back toward the middle band.

RSI: The 14-period Relative Strength Index (RSI) stands at 29.46, placing USD/SGD in oversold territory. While this reflects strong recent selling pressure, an oversold condition can sometimes precede a short-term consolidation or corrective pullback.

MACD: The MACD indicator for USD/SGD sits at -0.00383, remaining below the zero line. This negative reading indicates ongoing bearish momentum on the daily frame, though traders will watch for any potential convergence or slowing downside momentum.

Support and Resistance:

Key daily technical levels for USDSGD include immediate support at 1.26885 and key resistance at 1.29797. A sustained break below support could open a path toward lower support zones, whereas a push above resistance would be required to shift the broader structure back toward a bullish bias.

News to Watch for USDSGD This Week:

  • CB Consumer Confidence: This index reflects household confidence levels which can influence expectations regarding US economic growth and dollar demand.
  • Core PCE Price Index m/m: As a key measure of underlying consumer inflation, this release may impact market expectations for upcoming interest rate decisions.
  • Prelim GDP q/q: Updated quarterly economic output figures provide insights into overall US growth strength and currency valuation.
  • Prelim GDP Price Index q/q: Broad inflationary trends captured in GDP data offer additional clues regarding macroeconomic momentum.
  • Unemployment Claims: Weekly jobless claims serve as a timely snapshot of labor market health that can drive short-term price fluctuations.
  • Prelim Benchmark Payrolls Revision: Annual benchmark revisions to employment figures could alter baseline assessments of labor market strength.

Weekly Outlook and Consideration:

The USD/SGD pair enters the week under technical pressure, supported by an oversold RSI of 29.46 and negative MACD values near -0.00383. Price action remains compressed near the lower Bollinger Band around 1.26948, close to key support at 1.26885. Should support at 1.26885 fail to hold, extended downside movement remains possible. Conversely, an oversold bounce could see price test resistance higher toward the middle Bollinger Band at 1.28050 or resistance at 1.29797. Key macroeconomic events this week could spark volatility, requiring careful risk management.

Disclaimer: The analysis provided for USD/SGD is for informational purposes only and does not constitute investment advice. Traders are encouraged to perform their own analysis and research before making any trading decisions. Market conditions can change quickly, so staying informed with the latest data is essential.

1USD = –––SGD –––% ▼
USDSGD
Loading chart...