
D1 structure and negative momentum keep the weekly bias bearish, while neutral H4 conditions and a mixed close sequence argue against treating the move as one-sided.
Daily check — 11 November 2026: The latest completed D1 close was 88.931 on 10 November 2026. It remains below the upper formal invalidation level 89.231; the lower calibrated boundary 86.970 is an extension/confirmation boundary. The authored weekly thesis remains valid.
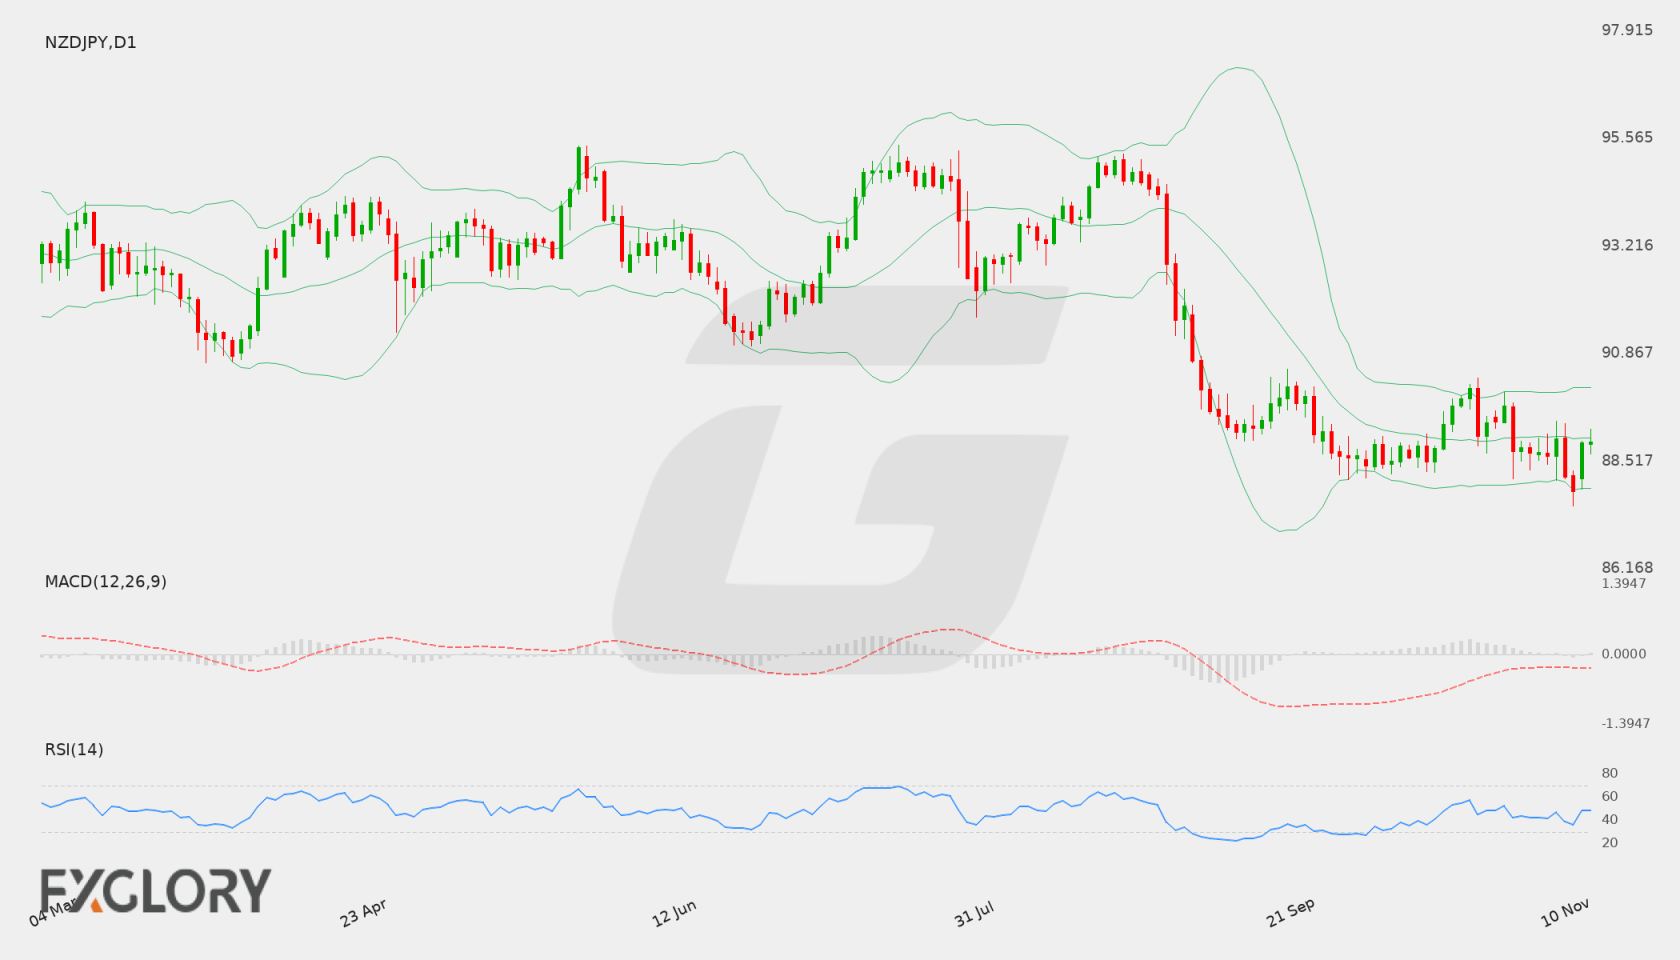
NZD/JPY Weekly Forecast at a Glance
In brief
Bearish bias: D1 trend, negative momentum and a close below its key averages favor weakness, but neutral H4 and mixed closes make the setup conditional rather than one-sided.
The controlling read is on D1. The last close at 87.872 sits below the EMA20 at 88.90235, the EMA50 at 89.7726 and the SMA200 at 92.31219, while the EMA50 and SMA200 slopes are both falling. That alignment, together with MACD below zero and beneath its signal line and an RSI of 36.04 under 50, forms the bearish foundation of the weekly thesis. Price remains above primary support at 87.523 but below primary resistance at 88.917, so the market is working inside a defined D1 range rather than extending to a new extreme.
Momentum and tactical context add nuance without reversing the picture. D1 MACD is below its signal with a negative histogram, supporting the bearish direction, yet the mixed close sequence means the trend has not yet produced a clean run of lower closes. H4 is neutral: its close at 88.634 is above H4 support at 88.594 and the H4 EMA20, but below the H4 EMA50 at 88.657 and H4 resistance at 88.663, which keeps tactical pressure two-sided. Stable volatility, with D1 ATR at 0.78408, points to a developing range rather than a sudden expansion. The only scheduled event supplied falls after this window, on 17 Nov 2026 05:00 GMT+3.
- Bullish targets
-
- T189.377
- T289.7726
- Bearish targets
-
- T186.7389 (projected)
- T285.9548 (projected)
- Invalidation
- One completed D1 close above 89.23063.
Selected key events
- Inflation Expectations q/q17 Nov 2026 05:00 GMT+3High
| Price at last update | 89.039 as of 11 Nov 2026 06:05 GMT+3 |
|---|---|
| Completed D1 reference close | 87.872 as of 6 November 2026 |
| Primary support | 87.523 |
| Secondary support | — |
| Primary resistance | 88.917 |
| Bullish targets | 89.377, 89.7726 |
| Bearish targets | 86.7389 (projected), 85.9548 (projected) |
| Formal weekly thesis invalidation | Upper 89.231 — One completed D1 close above 89.231 formally invalidates the bearish weekly thesis. |
Live NZD/JPY Tools
A forecast is a snapshot. These pages keep moving with the market.
- Live
Live chart & price
Watch NZD/JPY move tick by tick. Flip from the 1-minute chart to the monthly, with trading conditions right alongside.
- Live
Technical signals
Buy, sell or sit it out? Oscillators, moving averages and pivot points boiled down to one clear reading, updated live.
Economic calendar
Know what's coming before it hits the price: every scheduled release with impact, forecast and actual.
Historical data
Open, high, low and close on any timeframe from 1 minute to monthly. Test your idea, then download the data.
All NZD/JPY forecasts
Every weekly outlook in one place. Scroll back to see how earlier calls played out against the chart.
NZD/JPY Fundamental Drivers This Week
Scheduled economic events relevant to NZD/JPY during 9–14 November 2026 include Inflation Expectations q/q. Directional impact depends on the released data relative to supplied expectations.
Scroll table sideways for more columns →
| Event | Scheduled | Importance |
|---|---|---|
| Inflation Expectations q/q | 17 Nov 2026 05:00 GMT+3 | High |
Current NZD/JPY Price and Weekly Market Context
The weekly structure starts on D1, where the trend is bearish and momentum is negative. The 87.872 close sits below the D1 Bollinger middle at 88.9951 and beneath a descending moving-average stack, with EMA20 below EMA50 and SMA200 above both. Because the falling EMA50 and SMA200 cap the recovery path, the bearish read carries more weight than the H4 picture. H4 is neutral and volatility is stable, so the environment favors a developing range over an abrupt directional move.
- D1 trendbearishClose vs 50 EMA and 200 SMA
- H4 tacticalneutralH4 close vs 20 and 50 EMA
- MomentumnegativeRSI and MACD histogram
- VolatilitystableD1 ATR change
Is NZD/JPY Bullish or Bearish This Week?
The bearish scenario is the primary path because D1 trend, momentum and moving-average structure point in the same direction. The range between 87.523 and 88.917 is the central battleground, and the bullish, base and bearish paths differ mainly in whether a completed D1 close resolves that range. H4 provides timing context rather than the weekly direction.
Scenario 1 of 3Bullish reversal
- D1 confirmation
- A completed D1 close above primary resistance at 88.917 would be the first structural sign that the bearish D1 read is losing control, and a completed D1 close above secondary resistance at 89.377 would strengthen that shift.
- H4 tactical signal
- An H4 close above H4 resistance at 88.663 would show short-term pressure lifting, giving early tactical support to a push toward the D1 resistance zone.
- Targets
- 89.377, 89.7726
- Scenario failure condition
- The bullish case would weaken if H4 closes back below H4 support at 88.594 after an upside test, or if D1 fails to close above 88.917 while momentum remains negative.
Scenario 2 of 3Base / neutral
- D1 confirmation
- Consolidation is confirmed while D1 closes remain between primary support at 87.523 and primary resistance at 88.917, with no completed D1 close beyond either boundary.
- H4 tactical signal
- H4 price rotating around the H4 levels at 88.594 and 88.663 would fit a two-sided tactical picture in which neither side gains clear control.
- Targets
- Range between primary support at 87.523 and primary resistance at 88.917, with H4 reference levels at 88.594 and 88.663 inside that range.
- Scenario failure condition
- A completed D1 close above 88.917 or below 87.523 would move price out of this range and shift emphasis to the corresponding directional scenario.
Scenario 3 of 3Bearish continuation
- D1 confirmation
- A completed D1 close below primary support at 87.523 would confirm the bearish scenario by breaking the lower bound of the range, aligning with the existing below-average structure.
- H4 tactical signal
- An H4 close below H4 support at 88.594 would add tactical pressure and align short-term price action with the bearish D1 direction.
- Targets
- 86.7389 (projected), 85.9548 (projected)
- Scenario failure condition
- The bearish case would weaken if H4 closes back above H4 resistance at 88.663 and D1 later closes above primary resistance at 88.917, pointing to a recovery of the range top.
NZD/JPY D1 Outlook and H4 Technical Triggers
The daily timeframe controls the weekly thesis. H4 evidence is used only for earlier confirmation, tactical warning and scenario-failure context. Complete live H4, H1 and intraday readings remain on the Technical page.
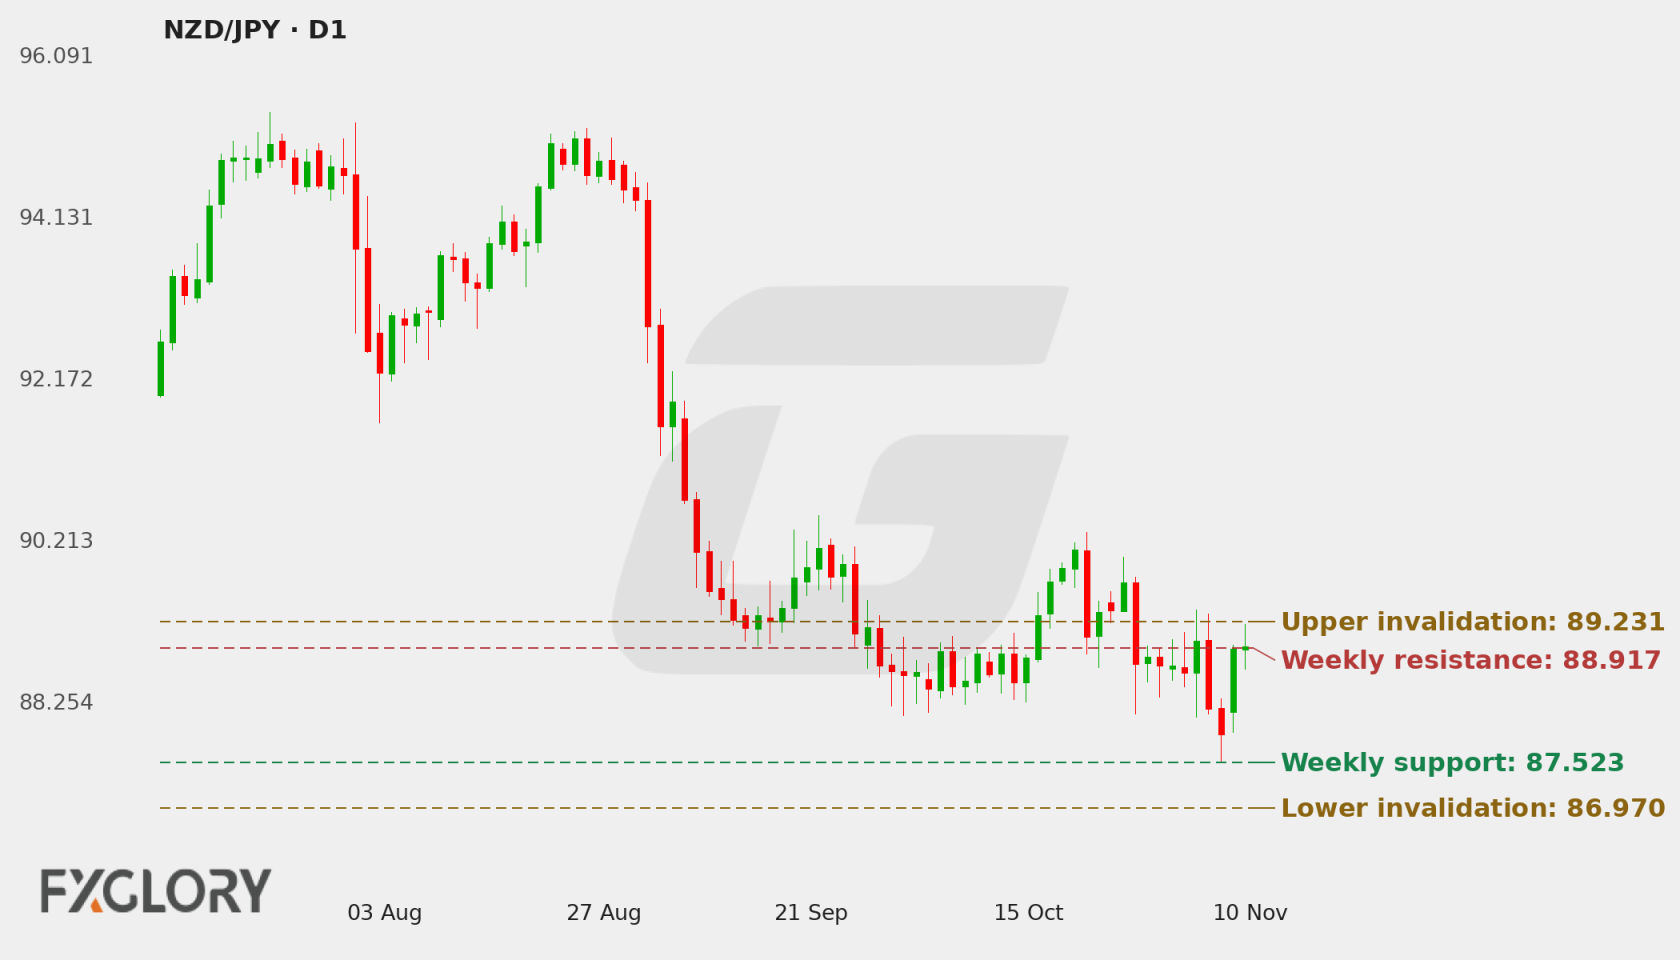
D1 Price Action and Market Structure
The D1 close at 87.872 remains above primary support at 87.523 and below primary resistance at 88.917, so price sits inside the weekly range but on the weaker side of the moving-average structure. It is below the EMA20 at 88.90235, the EMA50 at 89.7726 and the SMA200 at 92.31219, and it finishes beneath the lower Bollinger band at 87.88011 while the Bollinger middle sits at 88.9951. The mixed close sequence shows that recent closes have not established a clean directional run, so the structural read is informative but not yet decisive.
H4 Tactical Triggers
H4 adds tactical context rather than a separate weekly call. The H4 close at 88.634 is above H4 support at 88.594 and the H4 EMA20, and MACD sits above its signal with a positive histogram and RSI at 53.04, which together lean constructive in the short term. Against that, the close is below the H4 EMA50 at 88.657 and H4 resistance at 88.663, and MACD remains negative. H4 therefore delays rather than opposes the D1 bearish thesis, warning that upside tests toward 88.663 can still develop while D1 structure stays weaker.
Technical Indicators at a Glance
Automated technical summary
D1 is bearish with negative momentum, a mixed close sequence and stable volatility. H4 is neutral with a constructive short-term tilt. Primary levels are 87.523 and 88.917, with projected bearish reference targets at 86.7389 and 85.9548 and bullish target candidates at 89.377 and 89.7726.
Selected snapshot: D1 with H4 tactical context. Updated 11 November 2026.
- RSI36.04Neutral
- MACDBelow signalBearish
- Bollinger BandsOutside bandBelow lower band
- Moving averagesBelow bothBearish
- ATR78.4 pipsStable
RSI (14)
Neutral
H4 53.04
D1 RSI at 36.04 sits below 50, consistent with negative D1 momentum. H4 RSI at 53.04 is above 50, indicating firmer short-term momentum inside a larger weak D1 structure. The contrast suggests tactical momentum is recovering while the weekly trend has not yet changed.
- D1 RSI
- 36.04
- H4 RSI
- 53.04
MACD (12, 26, 9)
Bearish momentum
On D1, MACD is negative and below its signal line with a negative histogram, which confirms the bearish momentum read. On H4, MACD is still negative but above its signal with a positive histogram, a tactical improvement that supports the neutral H4 state without overturning the D1 direction.
- MACD
- -0.343104
- Signal
- -0.280388
- Histogram
- -0.062716
Bollinger Bands (20, 2σ)
Below lower band
Striped ends = price outside the bands.
On D1, the close sits below the middle band and finishes beneath the lower band, placing price on the weak side of its volatility envelope. On H4, the close is above the middle band, consistent with the tactical improvement, but the H4 position does not change the D1 bearish structure.
- Position in band
- 0.8 pips below lower
- Band width
- 223.0 pips (2.51%)
Moving averages (D1)
Bearish structure
- 50 EMA falling89.773Price is 190.1 pips below (-2.12%)
- 200 SMA falling92.312Price is 444.0 pips below (-4.81%)
D1 moving averages are arranged bearishly, with the EMA20 below the EMA50 and the SMA200 above both, while the close sits beneath all three and the EMA50 and SMA200 slopes are falling. The upper bullish target candidate at 89.7726 coincides with the D1 EMA50, so the moving-average ceiling and the upside reference line up. On H4, price is above the EMA20 and below the EMA50, consistent with a balanced tactical position.
- D1 close
- 87.872
- 50 EMA
- 89.773
- 200 SMA
- 92.312
ATR (14)
Stable volatility
One ATR either side of the latest close. A measure of move size, not a price target.
D1 ATR of 0.78408 and H4 ATR of 0.36712 are consistent with the stable volatility state. Stable volatility points to a developing environment without rapid expansion, which fits the consolidation risk inside the weekly range. It does not indicate direction. The projected bearish reference targets are built from D1 ATR, so they reflect this volatility measure rather than structural levels.
- D1 ATR
- 0.78408 (0.89%)
- H4 ATR
- 0.36712 (0.42%)
Technical conclusion: The D1 bearish thesis is the controlling view: trend, negative momentum and placement beneath the key averages align, while the close sits inside the 87.523 to 88.917 range. The strongest support comes from D1 structure and MACD momentum. The main counterargument is the H4 improvement, with MACD above its signal and RSI above 50, which could allow tests toward 88.663. The levels that matter next are primary resistance at 88.917, a completed D1 close above which would be the first structural shift toward the bullish case, and primary support at 87.523, a completed D1 close below which would confirm the bearish scenario.
View all live NZD/JPY oscillators, moving averages, pivot points and timeframe signals.
NZD/JPY Weekly Support, Resistance and Invalidation
| Level | Role | Timeframe | Why it matters |
|---|---|---|---|
| 87.523 | Primary support | D1 | Lower bound of the weekly range; a completed D1 close below it would confirm the bearish scenario. |
| 88.917 | Primary resistance | D1 | Upper bound of the weekly range; a completed D1 close above it is the first structural shift toward the bullish case. |
| 89.377 | Secondary resistance | D1 | Next structural ceiling above primary resistance, and also a bullish target candidate. |
| 89.7726 | Additional resistance candidate | D1 | Coincides with the D1 EMA50, so the moving-average ceiling and the upside reference line up. |
| 88.594 | H4 support | H4 | Tactical support; an H4 close below it would add near-term pressure to the bearish case. |
| 88.663 | H4 resistance | H4 | Tactical resistance above the H4 close, where upside tests could stall while D1 structure remains weaker. |
These are forecast-specific market-structure levels. Formula-based Classic, Fibonacci and Camarilla pivots remain on the Technical page.
Economic News & Events to Watch for NZD/JPY This Week
Selected events may increase NZD/JPY volatility. Direction depends on the released value relative to consensus and previous results.
Scroll table sideways for more columns →
| Event | Date and time | Importance | Previous | Consensus |
|---|---|---|---|---|
| Inflation Expectations q/q | 17 Nov 2026 05:00 GMT+3 | High | — | — |
Calendar source: FXGlory economic calendar. Retrieved 09 Nov 2026 15:26 GMT+3. View the complete NZD/JPY economic calendar.
NZD/JPY Outlook for 9–14 November 2026
The weekly bias remains bearish because D1 trend, momentum and moving-average structure point the same way, with the close beneath its key averages and MACD below its signal line. The thesis is conditional on the 87.523 to 88.917 range breaking to the downside on a completed D1 close. Until then, the setup reads as developing weakness rather than an established trend extension.
Neutral H4 conditions and the mixed D1 close sequence are the main reasons for restraint. H4 closing above support with MACD above its signal keeps upside tests toward 88.663 and the bullish target area plausible, and stable volatility makes a slow, range-bound development credible. The completed D1 closes at 87.523 and 88.917 are the decisive tests, while the NZD release dated 17 Nov 2026 05:00 GMT+3 falls outside this window.
Weekly Forecast Risks and What Would Change the Outlook
- Tactical H4 recovery: An H4 close above H4 support at 88.594, with MACD above its signal and RSI at 53.04, could support tests of H4 resistance at 88.663 and keep price inside the range longer than the D1 trend implies.
- Mixed D1 close sequence: A mixed close sequence means D1 has not yet produced a decisive run of closes, so the structural read can change quickly if a completed D1 close occurs beyond 87.523 or 88.917.
- Range-bound consolidation: Stable volatility, D1 ATR of 0.78408 and the 87.523 to 88.917 range support a slow development in which directional conviction stays limited.
- Event timing: The NZD inflation expectations release is high impact but falls after the forecast window, and no actual, forecast or previous value was supplied, so it cannot be treated as a weekly driver.
Formal weekly invalidation: The bearish weekly thesis is formally invalidated by one completed D1 close above 89.23063. One completed D1 close below 86.97030 confirms lower structural extension and continuation.
NZD/JPY Weekly Forecast FAQs
Is NZD/JPY bullish or bearish this week?
The weekly bias is bearish. The D1 trend is bearish, D1 momentum is negative, and the close sits beneath its EMA20, EMA50, SMA200 and Bollinger middle band, which is why D1 structure controls the forecast. Neutral H4 conditions keep the call conditional rather than certain.
What scenario would strengthen for NZD/JPY this week?
The primary path is continued weakness, which becomes more relevant if D1 closes below primary support at 87.523 and H4 closes below 88.594. The main alternative is a range between 87.523 and 88.917, while a shift toward the bullish case would need a completed D1 close above 88.917.
What are the key NZD/JPY support and resistance levels?
Primary support is 87.523 and primary resistance is 88.917, with secondary resistance at 89.377. Projected ATR-based bearish reference targets are 86.7389 and 85.9548, while bullish target candidates are 89.377 and 89.7726. H4 levels at 88.594 and 88.663 frame short-term tactical behavior.
What would invalidate this NZD/JPY forecast?
The bearish weekly thesis is formally invalidated by one completed D1 close above 89.23063.
Methodology, Data and Sources
- Price-data source: FXGlory price feed (NZDJPY)
- Live quote timestamp: 11 Nov 2026 06:05 GMT+3
- Weekly analysis timestamp: 9 November 2026
- Chart timestamp: 11 November 2026 (redrawn daily)
- Daily check: Every day at 04:00 GMT+3: the latest completed D1 close is checked against the invalidation levels and the chart is redrawn.
- Technical snapshot timestamp: 9 November 2026
- Calendar-data source: FXGlory economic calendar
- Calendar retrieval timestamp: 09 Nov 2026 15:26 GMT+3
- Candle convention: FXGlory D1 and H4 candles; D1 candle dates are evaluated in UTC and invalidation uses completed D1 closes only.
- Indicator settings: D1 RSI(14), MACD(12,26,9), Bollinger Bands(20,2), EMA(50), SMA(200), ATR(14); H4 RSI/MACD/Bollinger/EMA/ATR.
- Level-selection method: Weekly D1 support/resistance levels are structural market levels. Formal invalidation uses a hard 0.75× D1 ATR(14) minimum anchor distance plus a 0.40× D1 ATR(14) outward buffer; H4 levels are tactical only.
- Weekly forecast method: D1 controls the weekly thesis; H4 supplies tactical confirmation/warning only.