Time Zone: GMT +3
Time Frame: Daily (D1) / Weekly Outlook
Weekly Fundamental Overview:
The NZD/CHF currency pair reflects market sentiment across the New Zealand dollar and the Swiss franc. Imminent macroeconomic updates from both economies, including economic growth metrics and producer price signals, could influence short-term price movements. Traders will closely monitor these fundamental factors alongside shifts in global risk sentiment to gauge potential directional conviction.
Price Action:
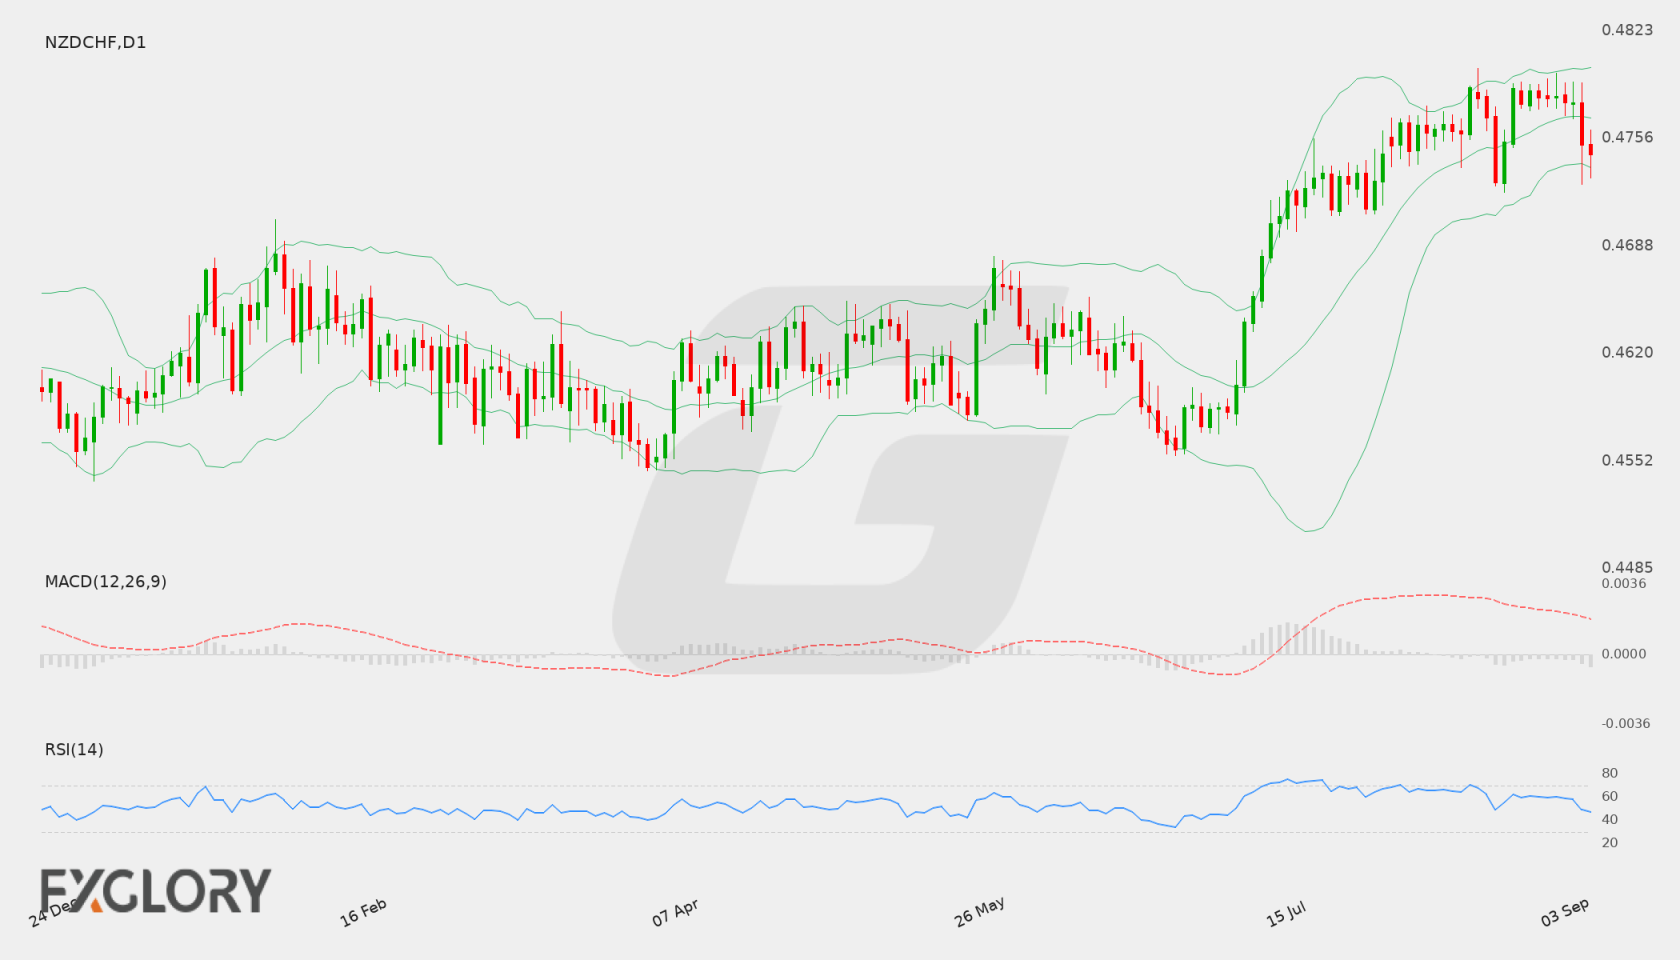
On the daily chart, NZDCHF recently experienced a moderate retreat from highs near 0.47870, with the price settling at 0.47456. Recent daily sessions display selling pressure that pushed price action below the recent consolidation area near 0.47800. A continuation of this downward traction could keep pressure on lower levels, while a bullish recovery would require buyers to clear recent short-term highs.
Key Technical Indicators:
Bollinger Bands: The Bollinger Bands feature a middle line at 0.47687, an upper band at 0.48000, and a lower band at 0.47373. With NZD/CHF closing at 0.47456, the price resides within the lower half of the channel. This position indicates mild short-term weakness toward the lower band at 0.47373, whereas a recovery above the 0.47687 middle boundary would be needed to normalize price action.
RSI: The 14-period Relative Strength Index (RSI) stands at 47.13. Operating just below the neutral 50 level, the indicator signals a balanced market condition without overbought or oversold extremes, favoring a slightly bearish-to-neutral tone.
MACD: The MACD indicator records a reading of 0.00115, holding above the zero threshold. While the metric remains positive, recent pullbacks in price suggest that upward momentum is softening, prompting traders to watch for potential crossover signals or momentum shifts.
Support and Resistance:
Primary technical boundaries on the daily timeframe locate major support at 0.45558 and significant resistance at 0.47995. Immediate overhead resistance aligns near the middle Bollinger band at 0.47687 and recent highs, while downside movement targets initial support around the lower Bollinger band at 0.47373.
News to Watch for NZDCHF This Week:
- PPI m/m: Measures changes in producer prices which can indicate shifting domestic inflationary pressures.
- GDP q/q: Evaluates overall quarterly economic growth and acts as a primary gauge for economic strength.
Weekly Outlook and Consideration:
Examining the daily timeframe, NZD/CHF is undergoing a brief retracement after failing to breach upper technical resistance. With the RSI at 47.13 and price action at 0.47456 positioned below the middle Bollinger band of 0.47687, the pair displays a neutral-to-soft tone. A sustained move below 0.47373 could open the door toward deeper support near 0.45558, while a rebound above 0.47687 could retest resistance near 0.47995.
Disclaimer: The analysis provided for NZD/CHF is for informational purposes only and does not constitute investment advice. Traders are encouraged to perform their own analysis and research before making any trading decisions. Market conditions can change quickly, so staying informed with the latest data is essential.