Time Zone: GMT +3
Time Frame: Daily (D1) / Weekly Outlook
Weekly Fundamental Overview:
GBP/CHF price dynamics continue to be influenced by macroeconomic conditions and risk sentiment surrounding the British Pound and the Swiss Franc. In the absence of scheduled economic calendar data, market participants remain focused on broader economic expectations and sentiment shifts.
Price Action:
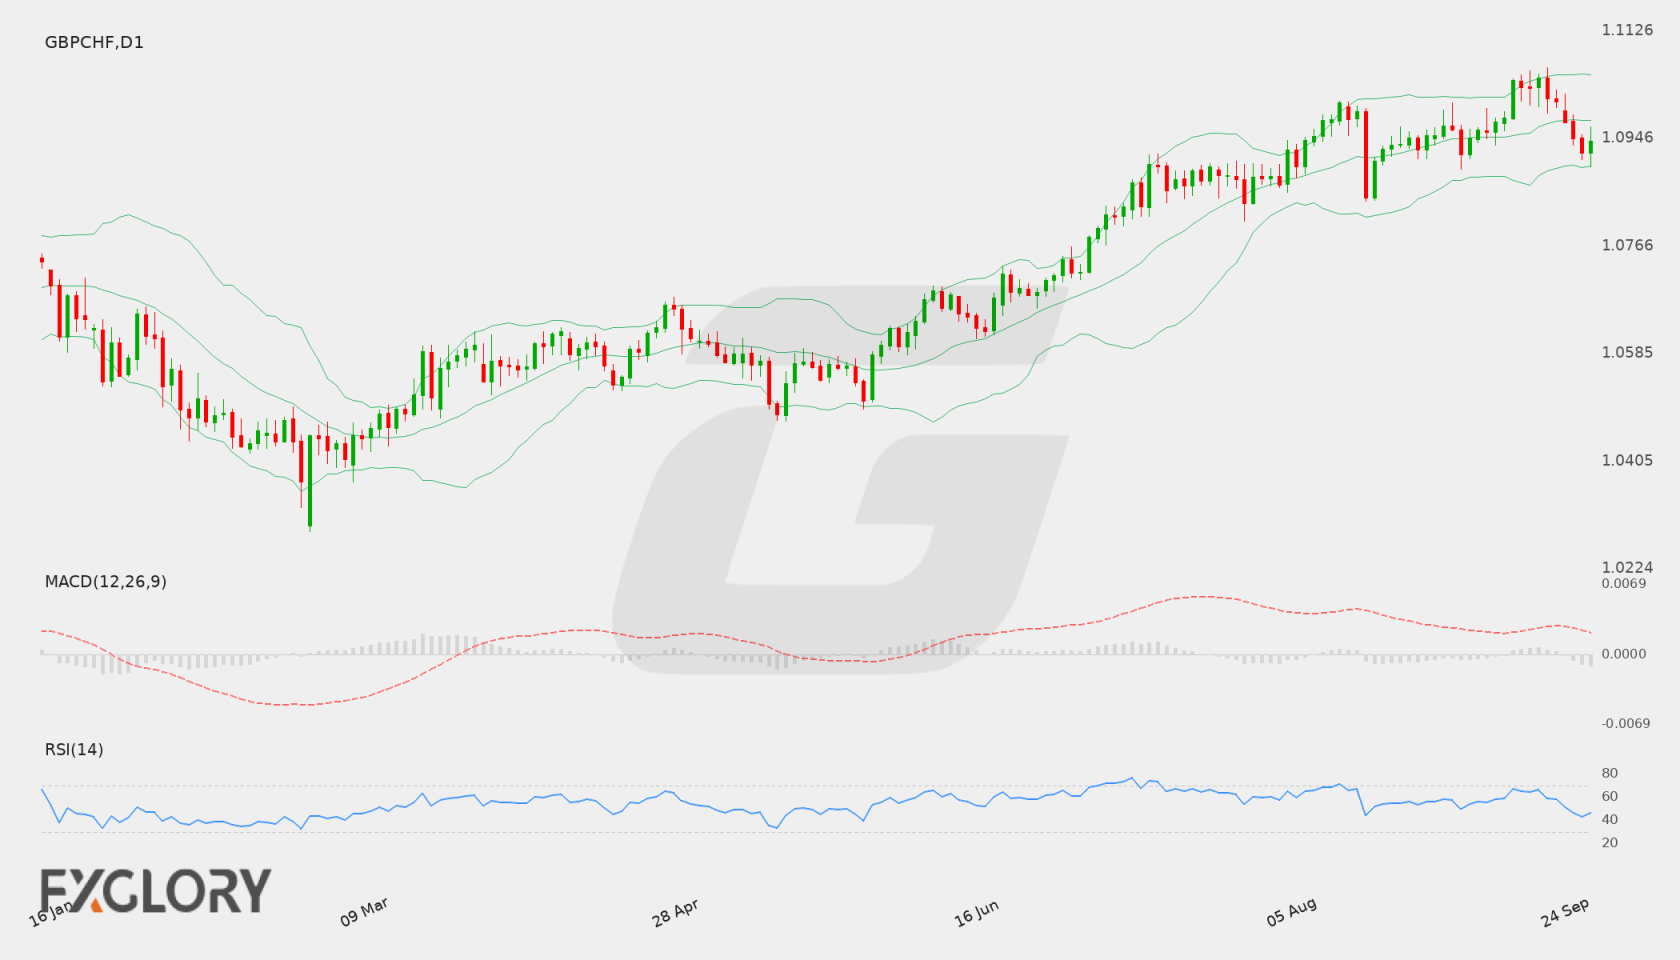
The Daily (D1) chart shows GBP/CHF retreating from recent high levels near the 1.1064 resistance region. After pressing above 1.1040, the pair experienced a mild pullback, eventually closing at 1.0941 to reflect short-term consolidation within its broader range.
Key Technical Indicators:
Bollinger Bands: The Bollinger Bands on the D1 timeframe show a middle simple moving average at 1.0976, an upper band at 1.1053, and a lower band at 1.0900. With the recent close at 1.0941, price action is currently fluctuating beneath the middle band, signaling neutral to slight downside pressure toward the lower band.
RSI: The 14-period Relative Strength Index (RSI) stands at 46.27, placing it in neutral territory below the 50 centerline. This reading indicates a balanced market environment without oversold or overbought extremes.
MACD: The MACD indicator registers a reading of 0.00095, holding slightly above the zero line. This indicates that underlying bullish momentum from prior advances persists, although the recent price dip points to easing upward momentum.
Support and Resistance:
Key technical parameters on the daily chart highlight substantial resistance at 1.10642 and primary structural support at 1.07094.
News to Watch for GBPCHF This Week:
- Economic Calendar: No specific events are available for this period, so traders should monitor generic high-impact releases, central bank comments, and broader risk sentiment.
Weekly Outlook and Consideration:
The weekly technical outlook for GBP/CHF indicates a neutral trading environment following the pullback to 1.0941. With the RSI at 46.27 and MACD at 0.00095, the pair displays mixed technical signals. A potential recovery above the 20-day middle Bollinger Band at 1.0976 could pave the way toward testing resistance at 1.10642. Alternatively, if selling pressure holds price below 1.0976, the lower Bollinger Band around 1.0900 and main support at 1.07094 remain key downside levels to watch.
Disclaimer: The analysis provided for GBP/CHF is for informational purposes only and does not constitute investment advice. Traders are encouraged to perform their own analysis and research before making any trading decisions. Market conditions can change quickly, so staying informed with the latest data is essential.