Time Zone: GMT +3
Time Frame: Daily (D1) / Weekly Outlook
Weekly Fundamental Overview:
LTC/USD has experienced a notable upward move, closing at 70.56 after accelerating higher. As a digital asset priced against the US dollar, LTCUSD performance remains aligned with broader cryptocurrency market trends and shifts in market risk sentiment. Upcoming economic indicators from the United States may also impact broader dollar dynamics and market sentiment surrounding risk assets.
Price Action:
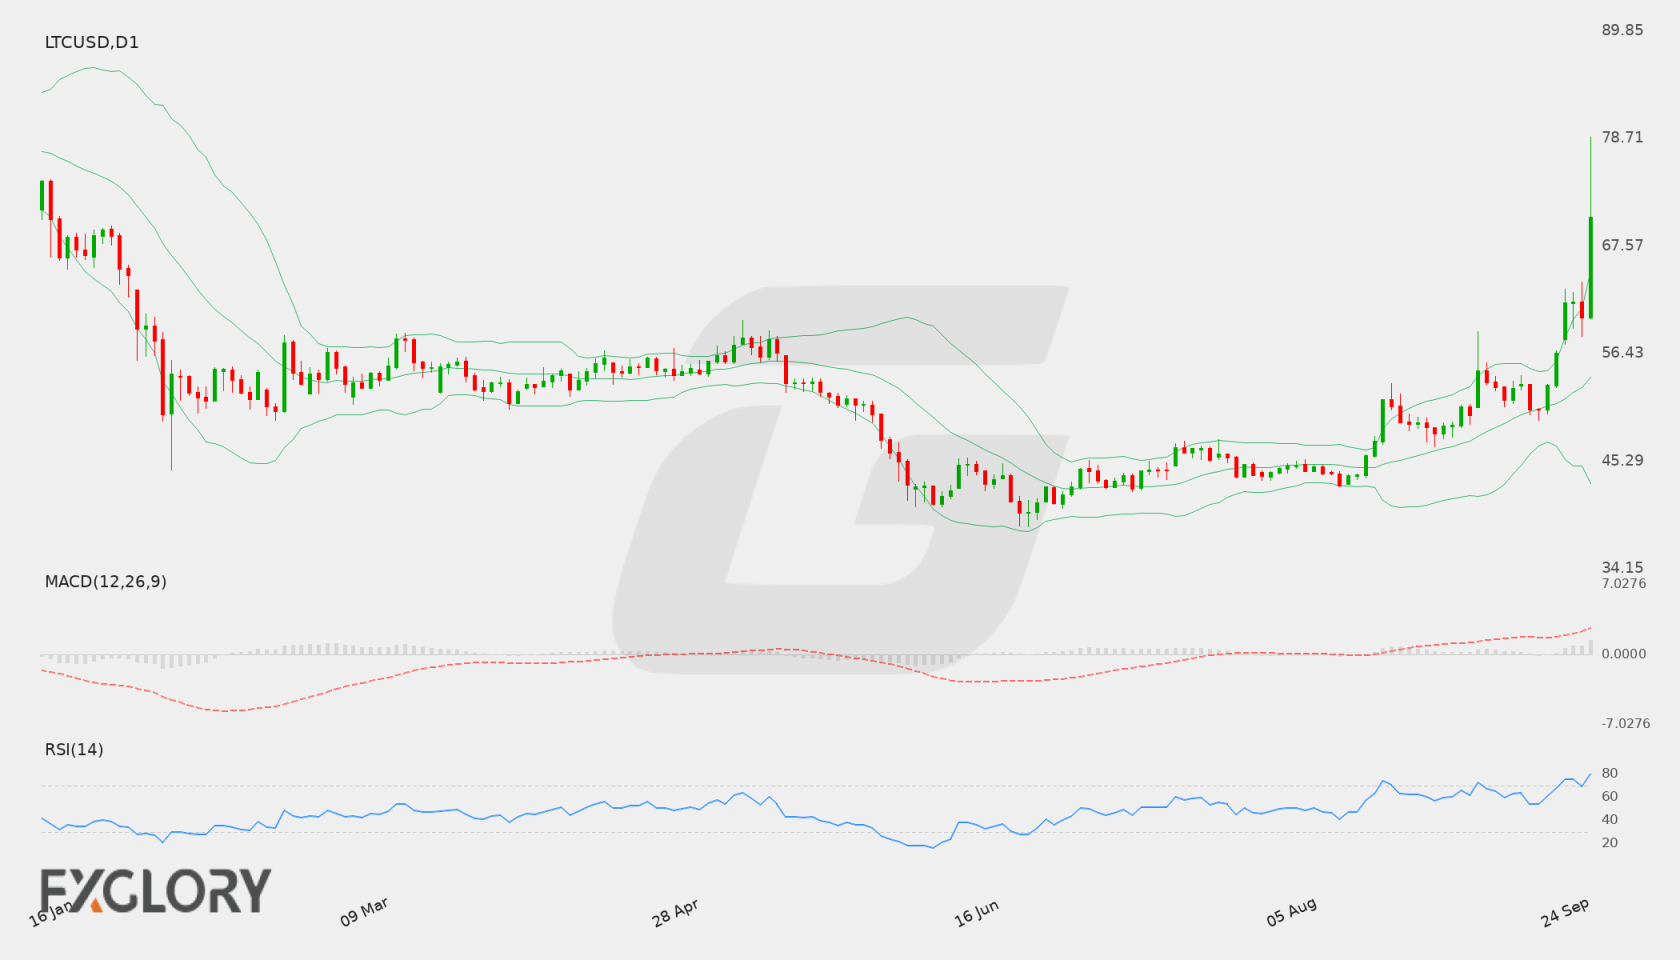
The Daily (D1) chart shows a rapid rise for LTC/USD from recent lows around 42.75 up through mid-range consolidation levels. The pair recently touched a high of 78.82 before settling at a close of 70.56, reflecting a strong bullish candle expansion accompanied by elevated trading volume.
Key Technical Indicators:
Bollinger Bands: The Bollinger Bands on the D1 timeframe indicate heightened volatility. The middle band stands at 53.97, with the upper band at 65.01 and the lower band at 42.94. LTC/USD closed at 70.56, positioning price action above the upper Bollinger Band.
RSI: The 14-day Relative Strength Index (RSI) is currently reading 79.84. This places the indicator firmly above the 70 threshold, signaling overbought condition after the swift price increase.
MACD: The MACD indicator reflects positive bullish momentum, printing a main value of 4.07. The positive trajectory aligns with the recent sharp price rally recorded on the daily chart.
Support and Resistance:
Key technical levels for LTC/USD include primary resistance at 78.82, which reflects the recent peak high. On the downside, identified major support is located at 42.13.
News to Watch for LTCUSD This Week:
- ISM Manufacturing PMI: US manufacturing activity data can sway overall financial market risk sentiment and impact crypto asset valuations against the dollar.
- ISM Manufacturing Prices: Inflationary signals within manufacturing data may influence broader macroeconomic expectations and risk appetite.
Weekly Outlook and Consideration:
LTC/USD displays powerful bullish momentum following its close at 70.56 and a test of resistance at 78.82. Technical parameters show price above the upper Bollinger Band (65.01) and a positive MACD at 4.07, though an RSI of 79.84 highlights overbought conditions. Traders will monitor whether LTCUSD can sustain levels above current support bands or if price consolidates back toward the middle band at 53.97 or technical support at 42.13.
Disclaimer: The analysis provided for LTC/USD is for informational purposes only and does not constitute investment advice. Traders are encouraged to perform their own analysis and research before making any trading decisions. Market conditions can change quickly, so staying informed with the latest data is essential.