Time Zone: GMT +3
Time Frame: Daily (D1) / Weekly Outlook
Weekly Fundamental Overview:
BTC/USD continues to be driven by shifts in global macroeconomic sentiment and broader demand for digital assets. Interest rate expectations in the United States and global liquidity conditions remain influential drivers for cryptocurrency market valuation. Traders will monitor upcoming US economic indicators to gauge overall risk sentiment.
Price Action:
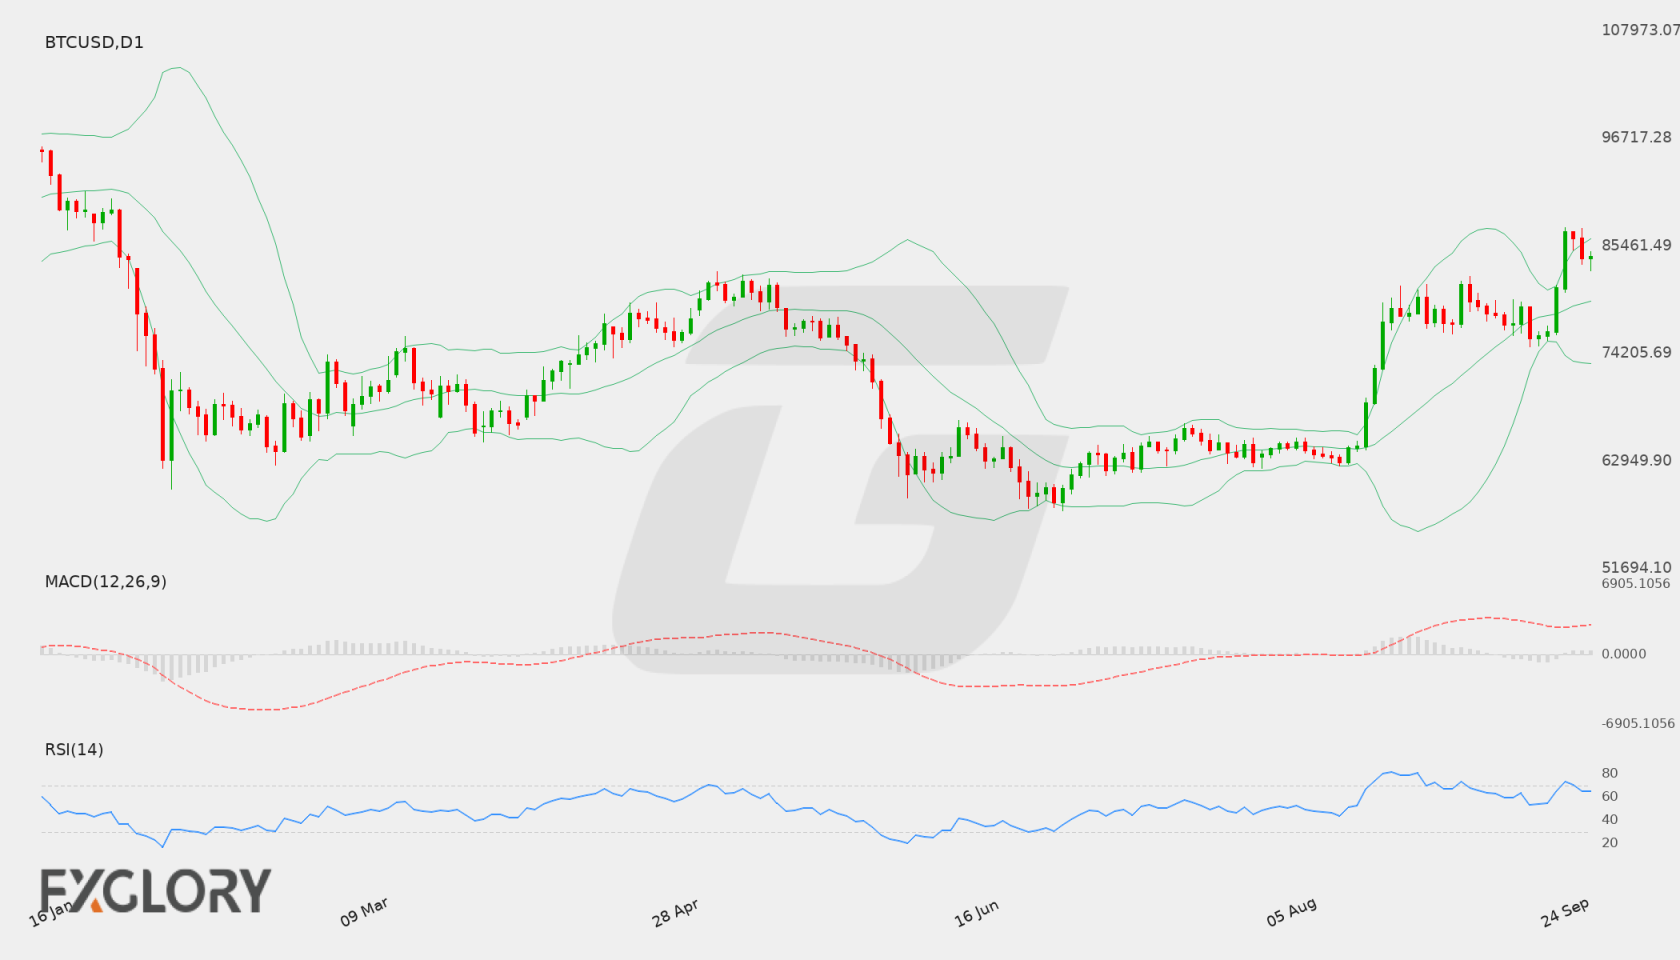
On the daily chart, BTC/USD recently pushed higher toward resistance at 87356.03 before settling around the last close of 84327.46. The pair has demonstrated strong upward momentum over recent daily sessions, keeping price action positioned firmly in positive territory.
Key Technical Indicators:
Bollinger Bands: The daily Bollinger Bands show the middle band at 79639.25, with the upper band at 86179.43 and lower band at 73099.07. Trading at 84327.46 places BTC/USD in the upper half of the band structure, reflecting heightened buying pressure.
RSI: The 14-period Relative Strength Index (RSI) is recorded at 64.97, indicating healthy bullish sentiment without crossing into deeply overbought territory above 70.
MACD: The MACD indicator stands at 3223.67, remaining in positive territory and signaling ongoing bullish momentum on the D1 timeframe.
Support and Resistance:
Key resistance is located at 87356.03, representing the recent peak. On the downside, primary technical support is identified at 61140.27.
News to Watch for BTCUSD This Week:
- ISM Manufacturing PMI: This release provides insight into US economic activity and potential shifts in broader risk sentiment.
- ISM Manufacturing Prices: This indicator measures inflationary pressures within the manufacturing sector that could impact market liquidity.
Weekly Outlook and Consideration:
The weekly technical setup for BTC/USD shows strong upward bias supported by a positive MACD of 3223.67 and an RSI of 64.97. With the last close at 84327.46, sustained momentum could lead to a retest of resistance near 87356.03. Conversely, if profit-taking emerges or macroeconomic conditions weigh on risk assets, price action may retreat toward the middle Bollinger Band near 79639.25 or further down toward main support at 61140.27.
Disclaimer: The analysis provided for BTC/USD is for informational purposes only and does not constitute investment advice. Traders are encouraged to perform their own analysis and research before making any trading decisions. Market conditions can change quickly, so staying informed with the latest data is essential.