Time Zone: GMT +3
Time Frame: Daily (D1) / Weekly Outlook
Weekly Fundamental Overview:
Broader macroeconomic conditions and market sentiment continue to influence Gold (GOLD). Shifting economic forecasts and inflation expectations may impact investor appetite for precious metals in the coming trading sessions.
Price Action:
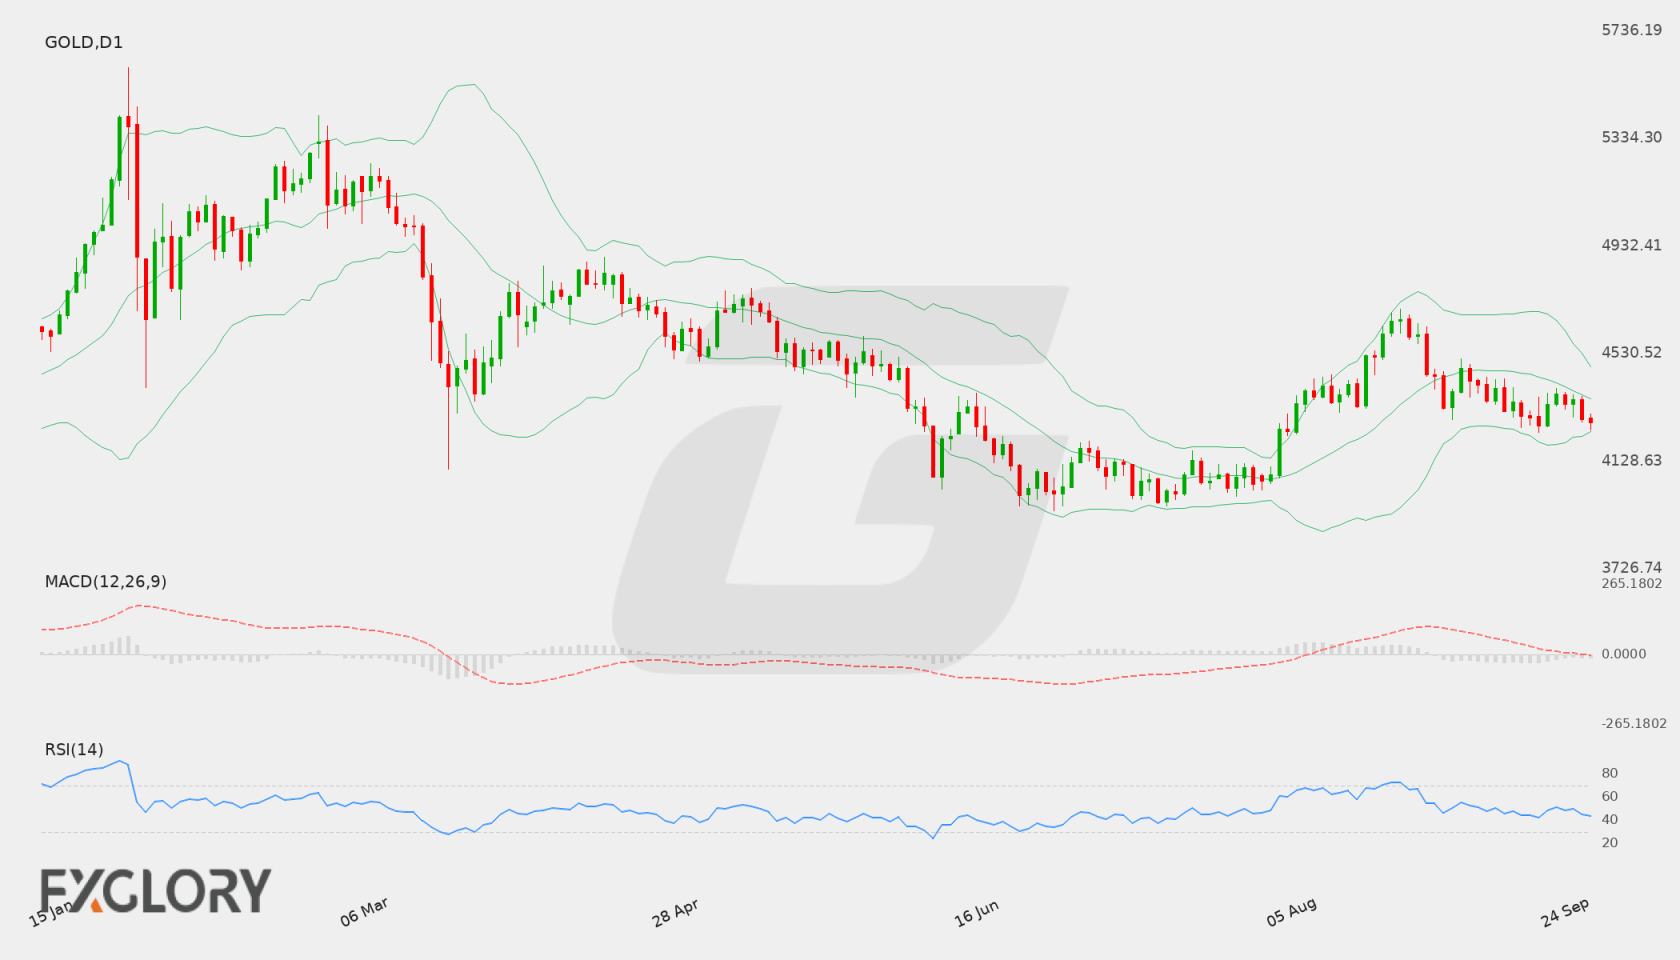
On the daily (D1) chart, Gold (GOLD) closed at 4274.89, following a gradual decline from recent highs near 4377.75. The recent daily candlesticks demonstrate persistent selling pressure as the asset trades closer to its lower boundary.
Key Technical Indicators:
Bollinger Bands: The D1 Bollinger Bands show the middle band at 4359.71, the upper band at 4481.26, and the lower band at 4238.17. Gold (GOLD) is trading below the middle band and approaching the lower band at its last close of 4274.89, reflecting downside momentum within the current volatility range.
RSI: The 14-day Relative Strength Index (RSI) stands at 43.71. Being below the 50 mark, this indicator signals moderate bearish sentiment without crossing into oversold conditions.
MACD: The D1 MACD indicator is currently reading -17.48. Remaining below zero, the negative value indicates ongoing bearish momentum across recent daily periods.
Support and Resistance:
Key technical levels on the daily chart show main support at 3959.49 and primary resistance at 4696.65. Price movement near these thresholds could determine the next significant trend direction.
News to Watch for GOLD This Week:
- ISM Manufacturing PMI: This indicator assesses manufacturing sector health and may influence market sentiment regarding economic growth.
- ISM Manufacturing Prices: This metric reflects cost pressures in manufacturing which can impact inflation outlooks and precious metal valuation.
Weekly Outlook and Consideration:
Gold (GOLD) approaches the new trading week under moderate bearish pressure, closing at 4274.89 below its daily Bollinger middle band of 4359.71. Technical indicators support a cautious outlook, with the RSI at 43.71 and MACD at -17.48. If downward momentum persists, price may move toward the primary support level at 3959.49. Alternatively, a move above the middle band could see price testing resistance toward 4696.65.
Disclaimer: The analysis provided for Gold is for informational purposes only and does not constitute investment advice. Traders are encouraged to perform their own analysis and research before making any trading decisions. Market conditions can change quickly, so staying informed with the latest data is essential.