Time Zone: GMT +3
Time Frame: Daily (D1) / Weekly Outlook
Weekly Fundamental Overview:
The USD/NOK currency pair continues to reflect shifts in international rate expectations and broader market risk sentiment. Upcoming economic releases from the US regarding consumer and producer prices are poised to drive volatility across dollar-denominated pairs, influencing interest rate outlooks. Meanwhile, the Norwegian Krone remains sensitive to global trade dynamics and energy market sentiment, keeping trader focus on key macroeconomic releases.
Price Action:
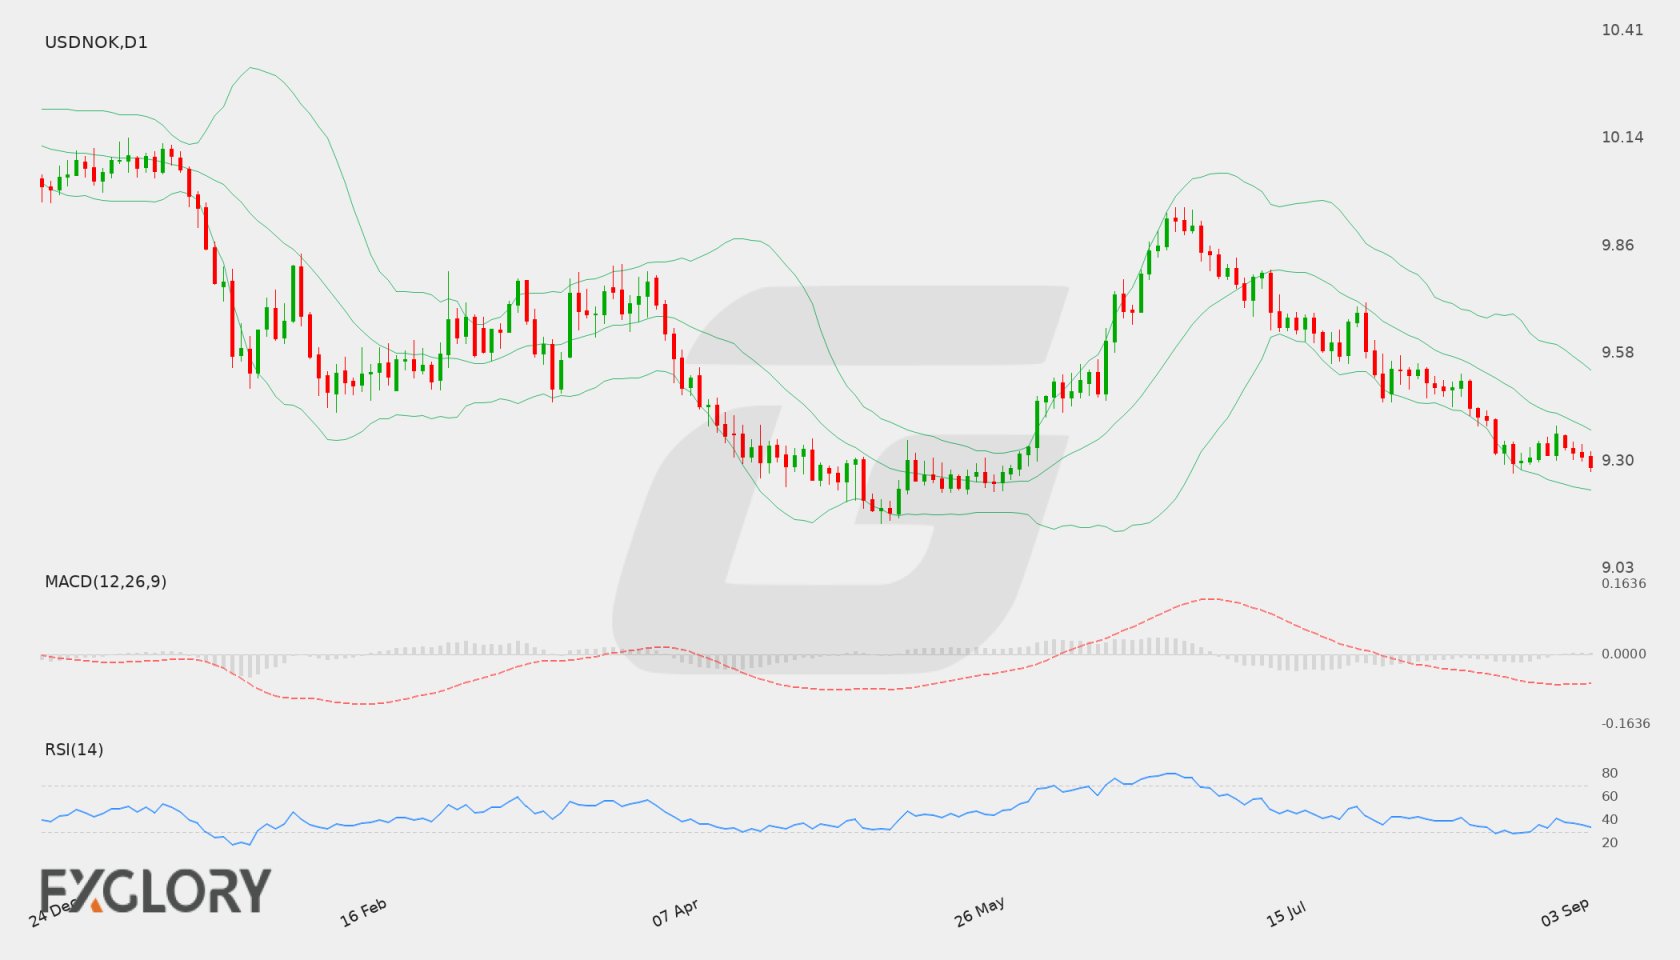
On the Daily (D1) chart, USD/NOK has experienced sustained downside pressure, dragging the pair down to a recent close of 9.28747. Price action shows a clear sequence of lower highs and lower lows over recent sessions, approaching key structural floors as sellers remain in control.
Key Technical Indicators:
Bollinger Bands: The Bollinger Bands indicator on the daily chart reflects active downward momentum. The middle band sits at 9.38225, with the upper band at 9.53713 and the lower band at 9.22737. Price action trading near 9.28747 remains positioned in the lower half of the band structure, signaling persistent bearish influence.
RSI: The 14-period Relative Strength Index (RSI) stands at 33.72, placing the indicator close to oversold conditions. While this underscores current selling pressure, it also hints that downside momentum could face deceleration near critical support levels.
MACD: The MACD indicator displays a negative reading of -0.06700 on the daily timeframe. The indicator remains beneath its zero threshold, confirming ongoing downside momentum and a lack of immediate bullish divergence.
Support and Resistance:
Key technical levels for USD/NOK on the daily chart show primary support at 9.27156. On the upside, major resistance is identified at 9.95824, serving as a key barrier should recovery attempts emerge.
News to Watch for USDNOK This Week:
- PPI m/m: Measures changes in producer prices to gauge underlying pipeline inflation pressures.
- Core PPI m/m: Evaluates producer inflation excluding volatile components for clearer policy signals.
- Unemployment Claims: Provides weekly insights into labor market conditions and economic stability.
- Core CPI m/m: Tracks monthly changes in core consumer prices to assess underlying inflation.
- CPI y/y: Shows annual headline consumer inflation trends impacting currency valuations.
- Core CPI y/y: Measures long-term core consumer price increases to inform policy expectations.
- CPI m/m: Captures month-over-month changes in consumer prices influencing monetary policy outlooks.
- Prelim UoM Inflation Expectations: Indicates consumer expectations regarding future price growth.
- Prelim UoM Consumer Sentiment: Gauges overall consumer confidence and spending tendency.
Weekly Outlook and Consideration:
USD/NOK enters the week with a bearish daily posture, closing near 9.28747. Technical indicators show MACD at -0.06700 and RSI at 33.72, reflecting strong downside pressure near the lower Bollinger Band at 9.22737. Traders will be monitoring whether support at 9.27156 holds, or if key US inflation releases trigger a push toward upper resistance at 9.95824.
Disclaimer: The analysis provided for USD/NOK is for informational purposes only and does not constitute investment advice. Traders are encouraged to perform their own analysis and research before making any trading decisions. Market conditions can change quickly, so staying informed with the latest data is essential.