
Positive momentum and a bullish H4 backdrop meet a neutral D1 trend and mixed close sequence, leaving the weekly picture conditional around the listed levels.
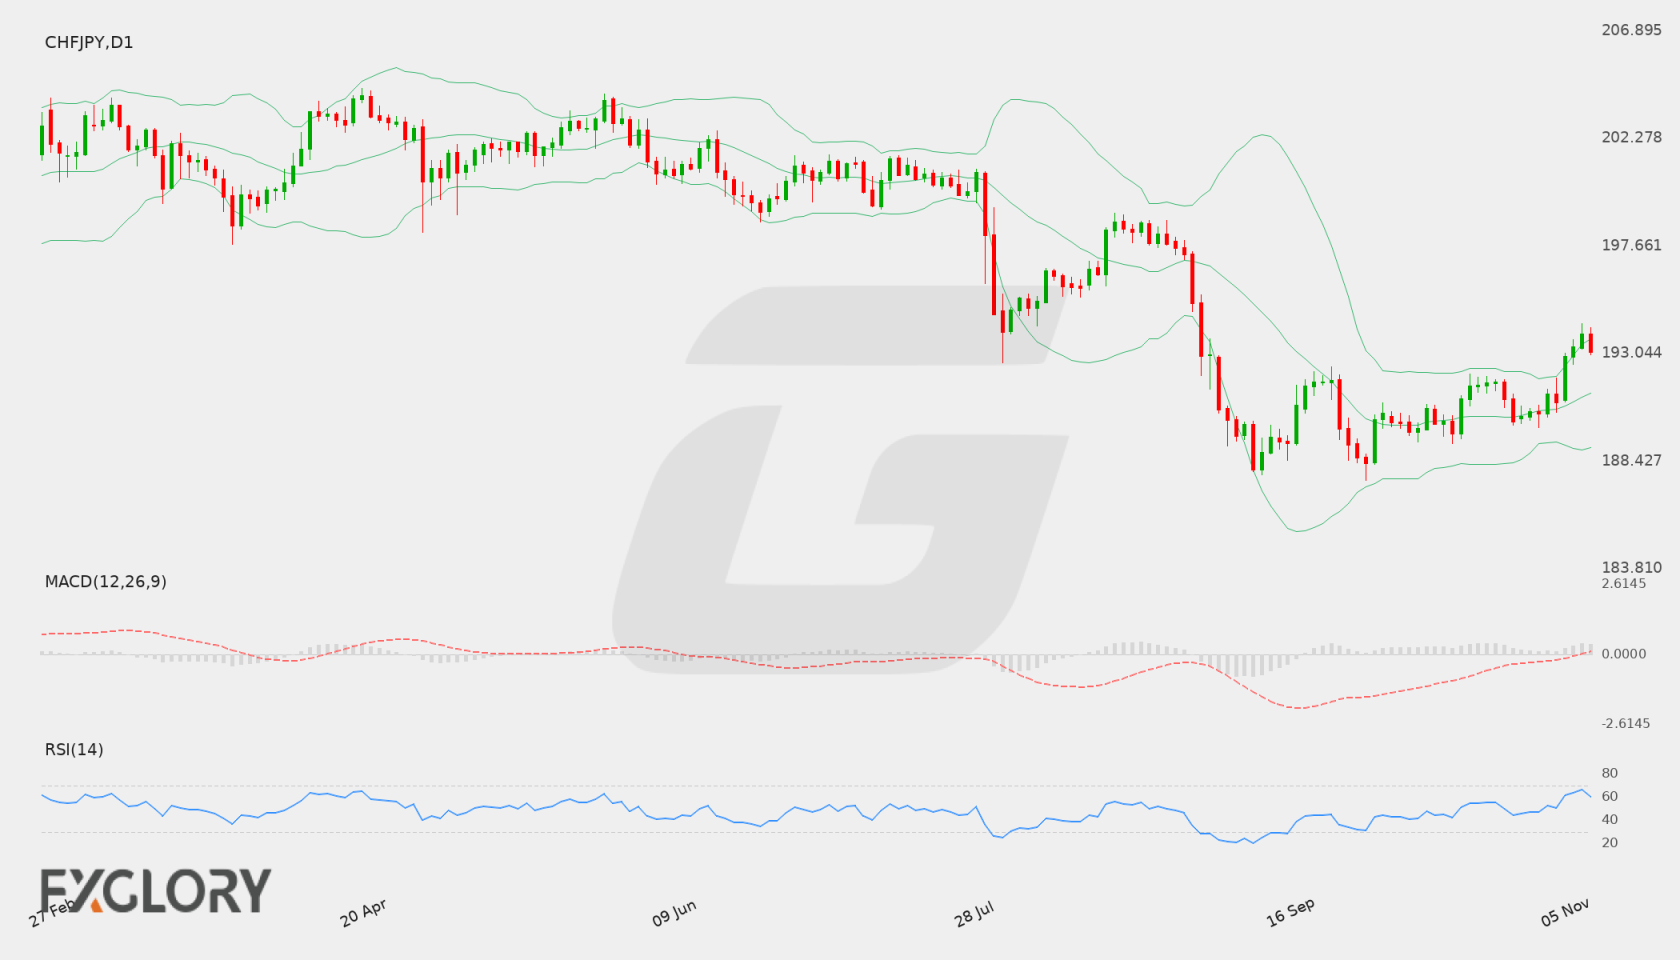
CHF/JPY Weekly Forecast at a Glance
In brief
The weekly bias is neutral: positive D1 momentum and bullish H4 conditions support the upside, but mixed D1 price action and a neutral trend state leave direction unresolved.
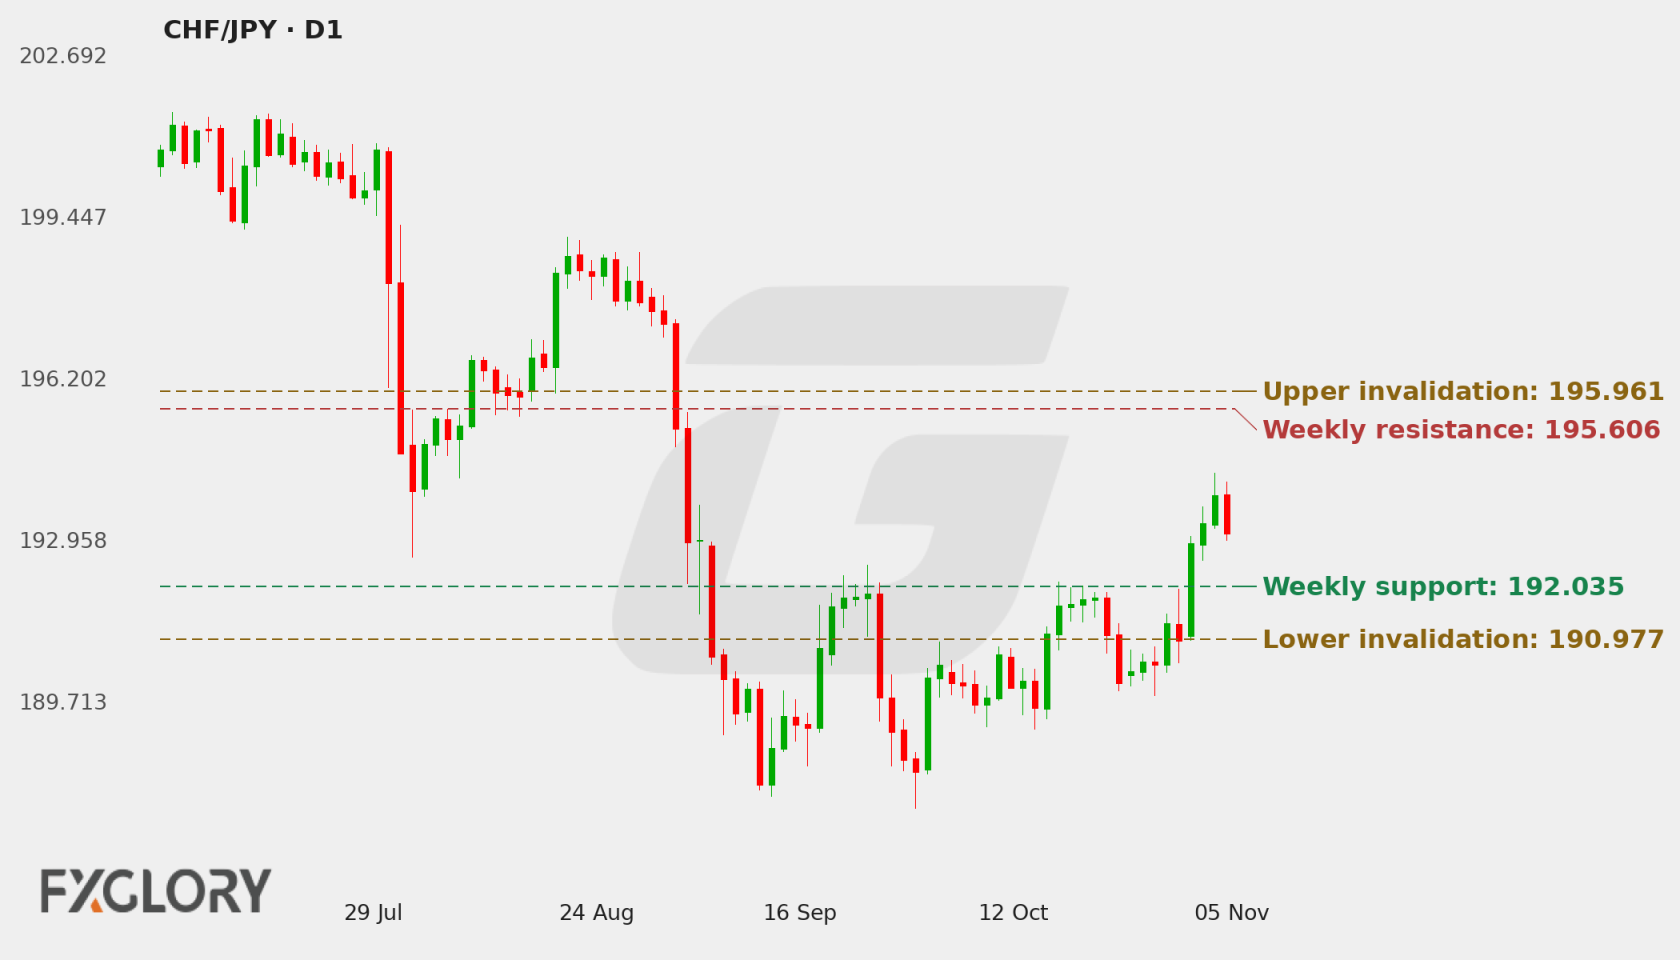
CHF/JPY closed at 192.908, above the first listed support at 192.03491 and below the first listed resistance at 195.606. D1 remains neutral with a mixed close sequence, so the reference close sits within a broader unresolved structure rather than establishing a directional break.
Momentum is constructive on D1, with MACD above its signal, a positive histogram and RSI above 50; price is also above the D1 EMA20 and EMA50. The falling EMA50 and SMA200 slopes, the close below the SMA200, and the bullish-but-tactically extended H4 RSI temper that support. Stable volatility and scheduled CHF and JPY events add timing uncertainty without specifying a directional outcome.
- Bullish targets
-
- T1196.681
- T2198.40141
- Bearish targets
-
- T1191.332
- T2189.954
- Invalidation
- One completed D1 close above 195.96129 or below 190.97671.
Selected key events
- BOJ Gov Ueda Speaks6 Nov 2026 19:00 GMT+3High
- CPI m/m3 Nov 2026 10:30 GMT+3Medium
- SNB Chairman Schlegel Speaks5 Nov 2026 15:40 GMT+3Medium
| Price at last update | 193.137 as of 07 Nov 2026 02:50 GMT+3 |
|---|---|
| Completed D1 reference close | 192.908 as of 2 November 2026 |
| Primary support | 192.035 |
| Secondary support | 191.332 |
| Primary resistance | 195.606 |
| Bullish targets | 196.681, 198.40141 |
| Bearish targets | 191.332, 189.954 |
| Formal weekly thesis invalidation | Upper 195.961 — One completed D1 close above 195.961 formally invalidates the neutral weekly thesis. Lower 190.977 — One completed D1 close below 190.977 formally invalidates the neutral weekly thesis. |
Live CHF/JPY Tools
A forecast is a snapshot. These pages keep moving with the market.
- Live
Live chart & price
Watch CHF/JPY move tick by tick. Flip from the 1-minute chart to the monthly, with trading conditions right alongside.
- Live
Technical signals
Buy, sell or sit it out? Oscillators, moving averages and pivot points boiled down to one clear reading, updated live.
Economic calendar
Know what's coming before it hits the price: every scheduled release with impact, forecast and actual.
Historical data
Open, high, low and close on any timeframe from 1 minute to monthly. Test your idea, then download the data.
All CHF/JPY forecasts
Every weekly outlook in one place. Scroll back to see how earlier calls played out against the chart.
CHF/JPY Fundamental Drivers This Week
Scheduled economic events relevant to CHF/JPY during 31 October–7 November 2026 include CPI m/m, SNB Chairman Schlegel Speaks, BOJ Gov Ueda Speaks. Directional impact depends on the released data relative to supplied expectations.
Scroll table sideways for more columns →
| Event | Scheduled | Importance | Consensus | Previous |
|---|---|---|---|---|
| CPI m/m | 3 Nov 2026 10:30 GMT+3 | Medium | 0.0% | 0.0% |
| SNB Chairman Schlegel Speaks | 5 Nov 2026 15:40 GMT+3 | Medium | — | — |
| BOJ Gov Ueda Speaks | 6 Nov 2026 19:00 GMT+3 | High | — | — |
Current CHF/JPY Price and Weekly Market Context
D1 controls the weekly assessment: its trend is neutral and its close sequence mixed, while the 192.908 reference close is above 192.03491 support and below 195.606 resistance. D1 momentum is positive, supported by MACD above its signal, a positive histogram and RSI above 50, but the close remains below the falling SMA200. H4 is bullish and trades above its listed support, adding tactical upside support rather than resolving the D1 structure. Stable volatility describes the pace environment, not a directional outcome.
- D1 trendneutralClose vs 50 EMA and 200 SMA
- H4 tacticalbullishH4 close vs 20 and 50 EMA
- MomentumpositiveRSI and MACD histogram
- VolatilitystableD1 ATR change
Is CHF/JPY Bullish or Bearish This Week?
The neutral base case reflects mixed D1 closes and a neutral trend state, despite positive momentum and bullish H4 conditions. A bullish alternative would become more relevant if D1 price action strengthens through the listed resistance area; a bearish alternative would require deterioration through support. Until those developments appear, neither the tactical H4 tone nor the momentum readings alone settle the weekly direction.
Scenario 1 of 3Bullish continuation
- D1 confirmation
- A bullish reading would strengthen if completed D1 price action advances beyond the listed primary resistance at 195.606 and holds the developing structure constructively. Positive D1 momentum and price above the D1 EMA20 and EMA50 already offer supporting context, while the falling moving-average slopes and close below the SMA200 remain counterevidence.
- H4 tactical signal
- H4 is already bullish, with its close above H4 support at 191.667 and above its EMA20 and EMA50. A further constructive H4 development toward and through its listed resistance at 193.057 would offer tactical support, but D1 price action would still need to establish the weekly case.
- Targets
- 196.681, 198.40141
- Scenario failure condition
- Failure to maintain the constructive D1 context around the listed support at 192.03491, particularly if the D1 close sequence remains mixed, would weaken the bullish alternative; a completed D1 close below the formal lower boundary would mark a more material shift.
Scenario 2 of 3Base / neutral
- D1 confirmation
- The neutral case remains consistent while D1 closes stay mixed and the D1 trend state remains unresolved between the listed support at 192.03491 and resistance at 195.606.
- H4 tactical signal
- Bullish H4 conditions may produce upward pressure within the broader neutral D1 structure. If H4 strength does not translate into a clearer D1 development, its tactical signal remains insufficient to settle the weekly direction.
- Targets
- The reference close at 192.908 is above primary support at 192.03491 and below primary resistance at 195.606. Continued two-sided trade within that framework would fit the neutral case; no directional target is required for this consolidation scenario.
- Scenario failure condition
- A completed D1 close beyond either formal boundary, above 195.96129 or below 190.97671, would materially weaken the unresolved, range-oriented interpretation.
Scenario 3 of 3Bearish reversal
- D1 confirmation
- A bearish interpretation would gain support if D1 price action weakens through primary support at 192.03491 and the positive momentum evidence deteriorates. The close below the falling SMA200 and the mixed close sequence are relevant cautions, but current positive D1 momentum does not yet confirm a bearish shift.
- H4 tactical signal
- H4 currently opposes the bearish alternative: its state is bullish, its close is above H4 support at 191.667, and MACD is above its signal with a positive histogram. A weakening H4 structure around that support would provide an early tactical warning, while D1 would remain controlling.
- Targets
- 191.332, 189.954
- Scenario failure condition
- A failure to establish D1 weakness below 192.03491, especially if positive momentum persists and H4 remains bullish, would undermine the bearish alternative; a completed D1 close above the formal upper boundary would mark a more material shift.
CHF/JPY D1 Outlook and H4 Technical Triggers
The daily timeframe controls the weekly thesis. H4 evidence is used only for earlier confirmation, tactical warning and scenario-failure context. Complete live H4, H1 and intraday readings remain on the Technical page.
D1 Price Action and Market Structure
The D1 reference close is 192.908, above primary support at 192.03491 and below primary resistance at 195.606. The supplied close-sequence state is mixed, which limits structural clarity. Price is above the D1 EMA20 and EMA50 but below the SMA200; the EMA50 and SMA200 slopes are falling. This combination shows near-term price strength within a less decisive broader trend backdrop, consistent with the neutral D1 classification.
H4 Tactical Triggers
H4 is bullish: the 192.908 close is above H4 support at 191.667, above its EMA20 and EMA50, and above the Bollinger middle. H4 MACD is above its signal with a positive histogram, reinforcing the tactical upside tone. RSI is 73.74 and above 50, a strong reading that also leaves the H4 advance more vulnerable to hesitation; it does not override the mixed, neutral D1 weekly structure. H4 resistance at 193.057 remains the nearest listed tactical reference.
Technical Indicators at a Glance
Automated technical summary
The D1 technical picture is mixed rather than directional: price is above the shorter moving averages and Bollinger middle, with positive MACD and RSI above 50, yet below the falling SMA200 and with a neutral trend state. H4 offers clearer bullish tactical alignment across price, moving averages and MACD, while its elevated RSI can complicate timing. Stable volatility does not resolve the conflict.
Selected snapshot: D1 with H4 tactical context. Updated 7 November 2026.
- RSI61.62Neutral
- MACDAbove signalBullish
- Bollinger BandsOutside bandAbove upper band
- Moving averagesBetweenNeutral
- ATR118.4 pipsStable
RSI (14)
Neutral
H4 73.74
D1 RSI is above 50, consistent with positive momentum and the close above the D1 EMA20 and EMA50. H4 RSI is also above 50 and materially higher in reading, supporting the tactical bullish state while indicating a stronger short-term momentum condition that may be more prone to pause. Neither RSI reading alone establishes a structural break.
- D1 RSI
- 61.62
- H4 RSI
- 73.74
MACD (12, 26, 9)
Bullish momentum
D1 MACD is above its signal, with a positive MACD reading and histogram, confirming constructive momentum within an otherwise neutral D1 structure. H4 shares that alignment, strengthening the tactical upside context rather than independently determining the weekly thesis.
- MACD
- 0.067233
- Signal
- -0.168308
- Histogram
- 0.235541
Bollinger Bands (20, 2σ)
Above upper band
Striped ends = price outside the bands.
The D1 close is above the Bollinger middle, consistent with positive near-term price positioning, while the H4 close is above its middle and near its upper band. This fits the bullish H4 tone but does not settle the neutral D1 structure; the supplied volatility state remains stable.
- Position in band
- 41.7 pips above upper
- Band width
- 340.4 pips (1.78%)
Moving averages (D1)
Neutral structure
- 50 EMA falling192.035Price is 87.3 pips above (+0.45%)
- 200 SMA falling198.401Price is 549.3 pips below (-2.77%)
Price above the D1 EMA20 and EMA50 supports the constructive momentum picture, but the close below the falling SMA200 and falling EMA50 slope temper the trend case. H4 price is above both supplied exponential averages, reinforcing tactical strength without replacing D1 as the weekly control.
- D1 close
- 192.908
- 50 EMA
- 192.035
- 200 SMA
- 198.401
ATR (14)
Stable volatility
One ATR either side of the latest close. A measure of move size, not a price target.
Stable volatility indicates no supplied expansion or contraction signal to favor faster level tests or compression. ATR describes the trading environment, not direction, so the listed support, resistance and conditional targets remain the relevant price framework.
- D1 ATR
- 1.1843 (0.61%)
- H4 ATR
- 0.50079 (0.26%)
Technical conclusion: The weekly structure remains neutral because mixed D1 closes and a close below the falling SMA200 offset positive D1 momentum and price above the shorter averages. Bullish H4 alignment is the strongest near-term counterweight, but its elevated RSI and the gap between tactical strength and unresolved D1 structure argue against treating that tone as a settled weekly direction. Primary support at 192.03491 and resistance at 195.606 frame the next structural assessment.
View all live CHF/JPY oscillators, moving averages, pivot points and timeframe signals.
CHF/JPY Weekly Support, Resistance and Invalidation
| Level | Role | Timeframe | Why it matters |
|---|---|---|---|
| 192.03491 | Primary support | D1 | The reference close is above this first listed support; its behavior helps distinguish continued neutral trade from a weakening D1 structure. |
| 191.332 | Secondary support | D1 | This is the next listed support and also a supplied bearish target; it is a reference in the conditional downside scenario, not a forecast outcome. |
| 189.954 | Additional support | D1 | This is the third listed support and a supplied bearish target, relevant only if downside development makes that scenario applicable. |
| 195.606 | Primary resistance | D1 | The reference close remains below this first listed resistance; D1 development here would help clarify whether positive momentum is translating into a stronger structure. |
| 196.681 | Secondary resistance | D1 | This is the next listed resistance and a supplied bullish target, relevant if the bullish alternative gains support. |
| 198.40141 | Additional resistance | D1 | This is the third listed resistance and a supplied bullish target; its role is conditional on further upside development. |
| 191.667 | H4 support | H4 | H4 is above this listed tactical support, consistent with its bullish state; weakness here would be an early tactical caution rather than a standalone weekly thesis change. |
| 193.057 | H4 resistance | H4 | The H4 close is below this listed resistance, making it a tactical reference for whether current H4 strength develops further. |
These are forecast-specific market-structure levels. Formula-based Classic, Fibonacci and Camarilla pivots remain on the Technical page.
Economic News & Events to Watch for CHF/JPY This Week
Selected events may increase CHF/JPY volatility. Direction depends on the released value relative to consensus and previous results.
Scroll table sideways for more columns →
| Event | Date and time | Importance | Previous | Consensus |
|---|---|---|---|---|
| BOJ Gov Ueda Speaks | 6 Nov 2026 19:00 GMT+3 | High | — | — |
| CPI m/m | 3 Nov 2026 10:30 GMT+3 | Medium | 0.0% | 0.0% |
| SNB Chairman Schlegel Speaks | 5 Nov 2026 15:40 GMT+3 | Medium | — | — |
Calendar source: FXGlory economic calendar. Retrieved 03 Nov 2026 04:22 GMT+3. View the complete CHF/JPY economic calendar.
CHF/JPY Outlook for 31 October–7 November 2026
CHF/JPY enters the forecast window with a neutral D1 structure: the 192.908 close is between listed primary support at 192.03491 and resistance at 195.606, while the close sequence remains mixed. Positive D1 momentum and price above the EMA20 and EMA50 offer a constructive counterweight, but the close below the falling SMA200 keeps the broader trend reading restrained.
Bullish H4 price and MACD conditions support near-term upside potential, yet H4 does not settle the weekly thesis and its RSI reading is elevated relative to D1. Stable volatility offers no directional cue. The listed CHF and JPY events may add repricing risk, so the balance remains conditional on how D1 responds around its established levels.
Weekly Forecast Risks and What Would Change the Outlook
- D1 trend and close-sequence ambiguity: The neutral trend and mixed close sequence leave the weekly structure unresolved even though D1 momentum is positive.
- D1 and H4 evidence do not fully settle the broader trend: Bullish H4 alignment and price above D1 EMA20 and EMA50 contrast with the close below the falling SMA200, limiting the strength of a directional interpretation.
- Tactical momentum may pause: H4 RSI is 73.74 while H4 remains bullish; that combination supports current strength but can also complicate the timing and continuity of the tactical move.
- Scheduled CHF and JPY events: Swiss CPI, an SNB Chairman speech and a BOJ Governor speech fall within the forecast window and may contribute to volatility or repricing without defining direction.
Formal weekly invalidation: The neutral weekly thesis is formally invalidated by one completed D1 close above 195.96129 or below 190.97671.
CHF/JPY Weekly Forecast FAQs
Is CHF/JPY bullish or bearish this week?
Neutral. The D1 trend and close sequence are unresolved despite positive momentum and bullish H4 conditions.
What scenario would strengthen for CHF/JPY this week?
A bullish interpretation would gain relevance if D1 strength develops beyond the listed resistance framework; a bearish interpretation would gain relevance if support gives way. Without such development, two-sided consolidation remains consistent with the neutral D1 state.
What are the key CHF/JPY support and resistance levels?
The reference close is 192.908; the primary support is 192.03491 and the primary resistance is 195.606. Secondary levels are 191.332 and 196.681, respectively.
What would invalidate this CHF/JPY forecast?
The neutral weekly thesis is formally invalidated by one completed D1 close above 195.96129 or below 190.97671.
Methodology, Data and Sources
- Price-data source: FXGlory price feed (CHFJPY)
- Live quote timestamp: 07 Nov 2026 02:50 GMT+3
- Weekly analysis timestamp: 31 October 2026
- Chart timestamp: 7 November 2026 (redrawn daily)
- Daily check: Every day at 04:00 GMT+3: the latest completed D1 close is checked against the invalidation levels and the chart is redrawn.
- Technical snapshot timestamp: 31 October 2026
- Calendar-data source: FXGlory economic calendar
- Calendar retrieval timestamp: 03 Nov 2026 04:22 GMT+3
- Candle convention: FXGlory D1 and H4 candles; D1 candle dates are evaluated in UTC and invalidation uses completed D1 closes only.
- Indicator settings: D1 RSI(14), MACD(12,26,9), Bollinger Bands(20,2), EMA(50), SMA(200), ATR(14); H4 RSI/MACD/Bollinger/EMA/ATR.
- Level-selection method: Weekly D1 support/resistance levels are structural market levels. Formal invalidation uses a hard 0.75× D1 ATR(14) minimum anchor distance plus a 0.30× D1 ATR(14) outward buffer; H4 levels are tactical only.
- Weekly forecast method: D1 controls the weekly thesis; H4 supplies tactical confirmation/warning only.