Time Zone: GMT +3
Time Frame: Daily (D1) / Weekly Outlook
Weekly Fundamental Overview:
The fundamental context for AUD/CAD is driven by relative monetary policy expectations and economic growth trajectories in Australia and Canada. Commodity price trends and trade developments continue to influence both currencies, leaving AUD/CAD responsive to broader risk sentiment and upcoming macroeconomic releases.
Price Action:
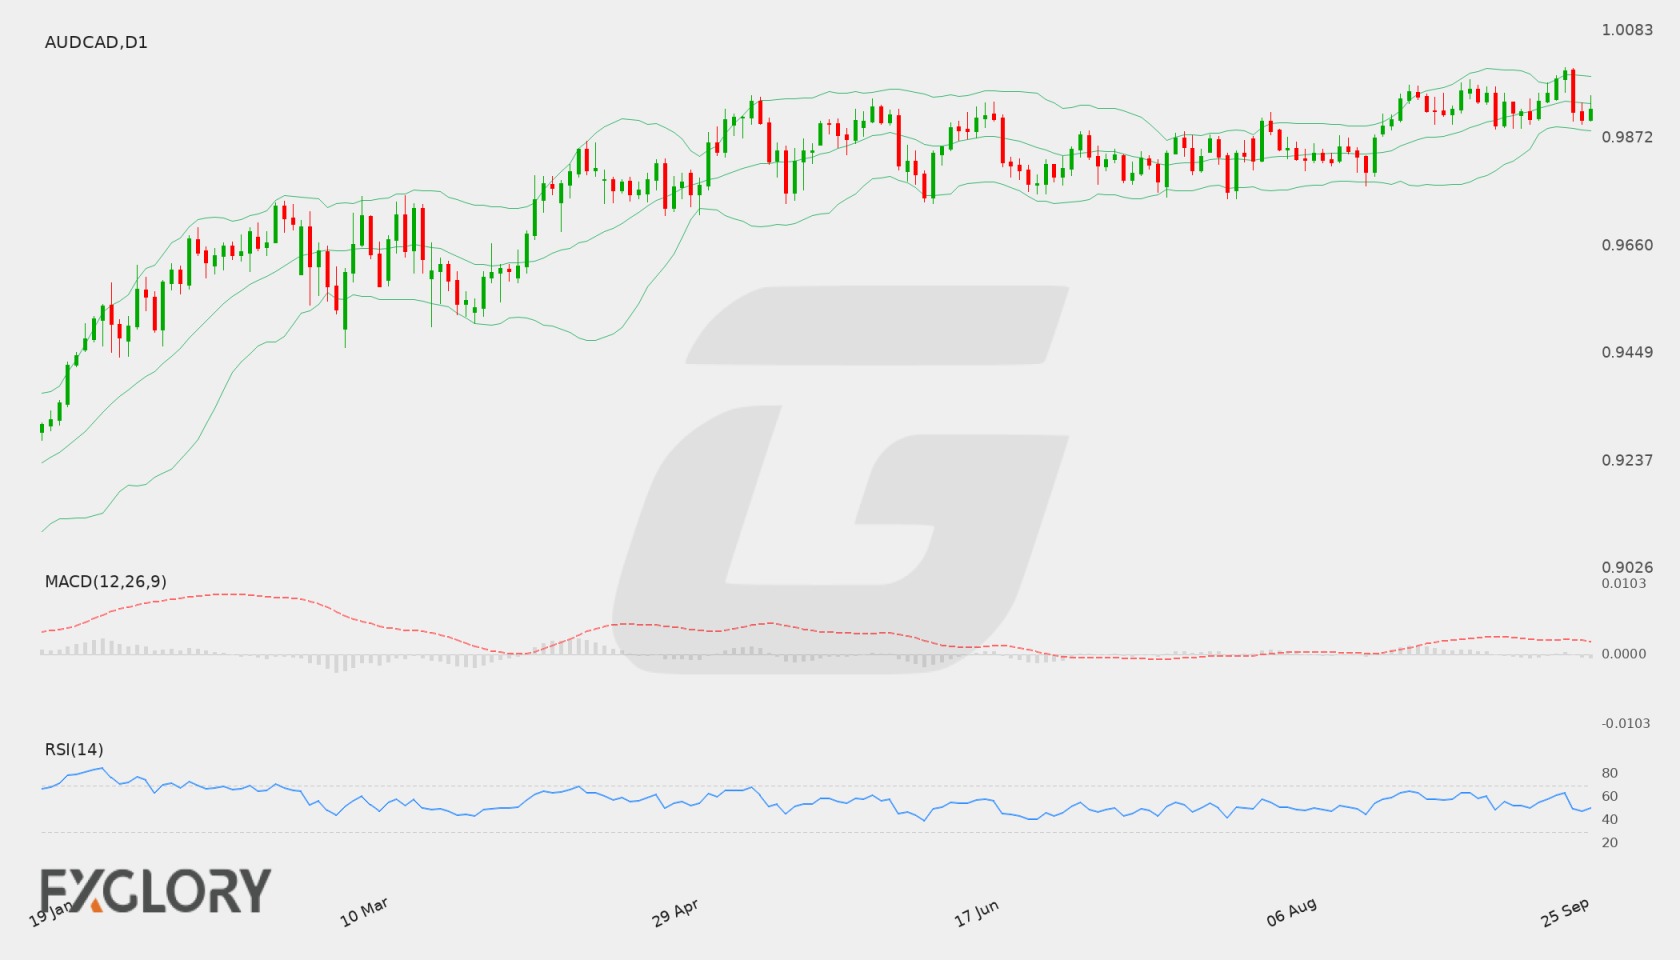
On the Daily (D1) timeframe, AUD/CAD recently reached a high near 1.00103 before pulling back toward 0.99088 and closing at 0.99291. Price action reflects a period of consolidation following a test of key resistance, with price searching for clear directional momentum.
Key Technical Indicators:
Bollinger Bands: The D1 Bollinger Bands show the middle band at 0.99399, the upper band at 0.99937, and the lower band at 0.98862. Price is trading near 0.99291, positioned just under the middle line, indicating a neutral volatility environment.
RSI: The 14-day RSI stands at 50.62, holding nearly at the neutral 50 baseline. This signals a balanced market with neither buyers nor sellers asserting definitive control at current levels.
MACD: The MACD indicator records a value of 0.00136, holding slightly above the zero line. While positive, the modest reading indicates modest underlying bullish sentiment that is currently lacking strong momentum.
Support and Resistance:
Key Daily technical levels include immediate resistance at 1.00103 and solid technical support down at 0.97524, defining the active trading range for AUD/CAD.
News to Watch for AUDCAD This Week:
- RBA Press Conference: Remarks by central bank leadership can provide insights into Australia's monetary policy outlook and influence exchange rate direction.
- GDP m/m: Monthly Canadian economic output data offers essential clues regarding growth momentum and interest rate expectations.
Weekly Outlook and Consideration:
AUD/CAD trades in a range-bound environment around the 0.99291 mark. With the RSI near 50.62 and price hugging the middle Bollinger Band at 0.99399, the pair requires a catalyst to break out. A decisive move above the 1.00103 resistance level could re-ignite bullish interest, whereas a drop below support at 0.97524 would suggest growing bearish momentum. Traders should monitor upcoming economic events for potential triggers.
Disclaimer: The analysis provided for AUD/CAD is for informational purposes only and does not constitute investment advice. Traders are encouraged to perform their own analysis and research before making any trading decisions. Market conditions can change quickly, so staying informed with the latest data is essential.