Time Zone: GMT +3
Time Frame: Daily (D1) / Weekly Outlook
Weekly Fundamental Overview:
The AUD/CHF pair reflects the balance between risk-sensitive Australian Dollar dynamics and the safe-haven properties of the Swiss Franc. Broader global risk appetite and commodity markets influence the pair, while domestic Swiss factors like producer price changes also play a role in shaping market expectations for monetary policy and currency valuation.
Price Action:
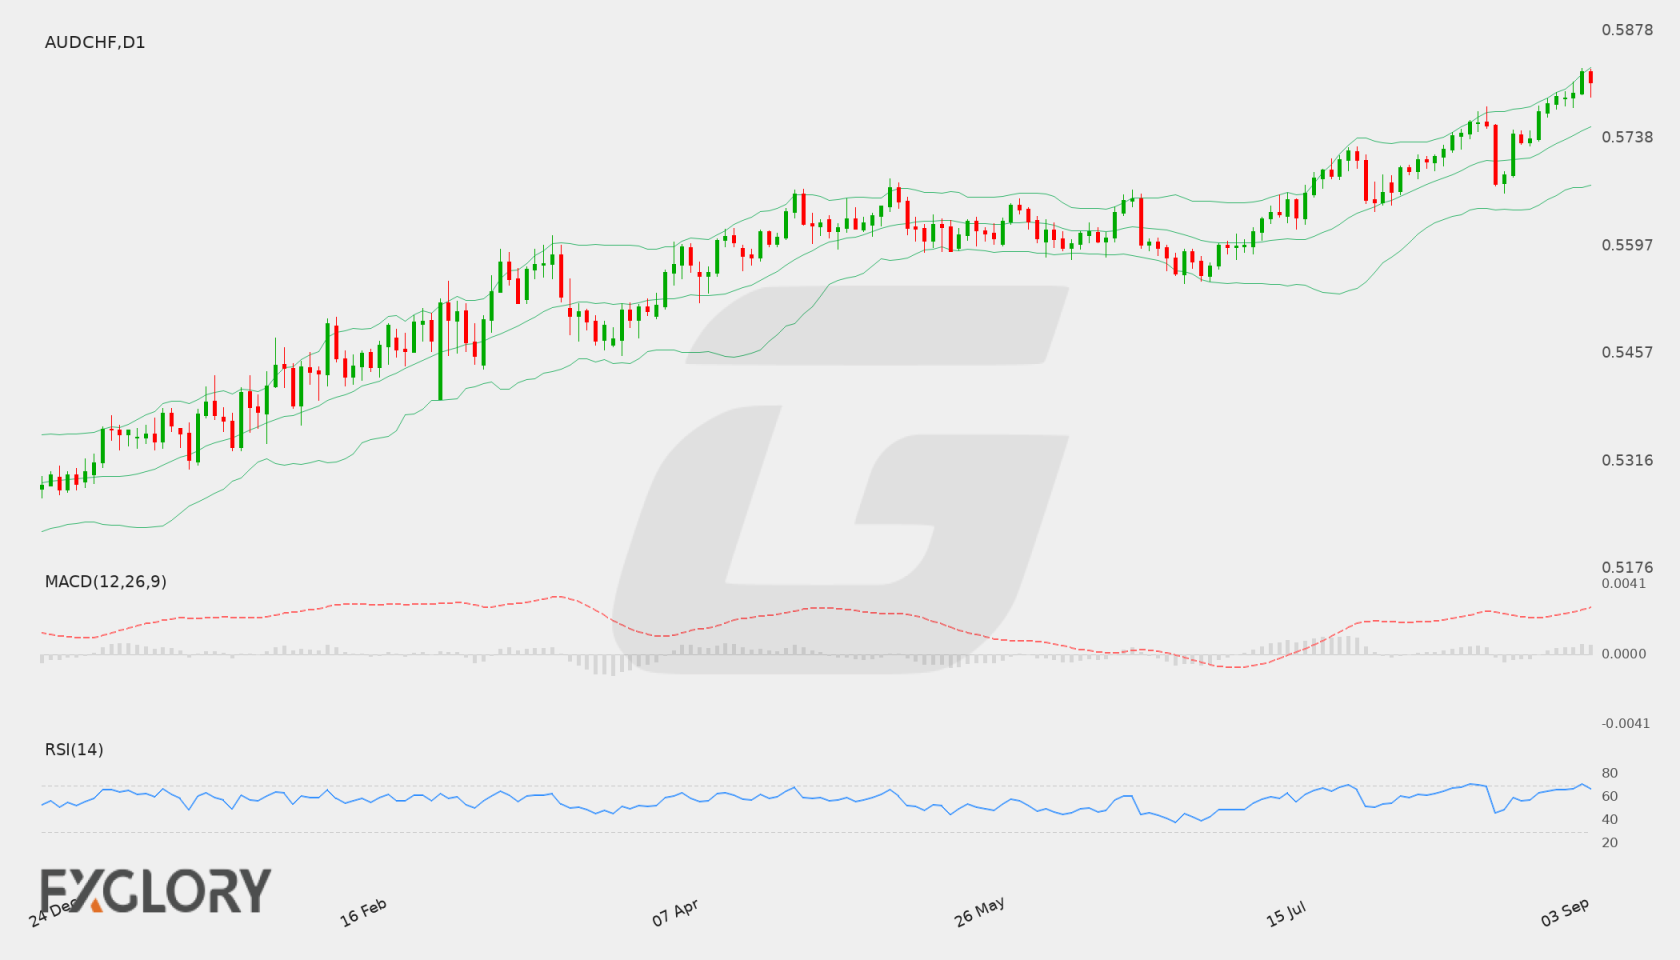
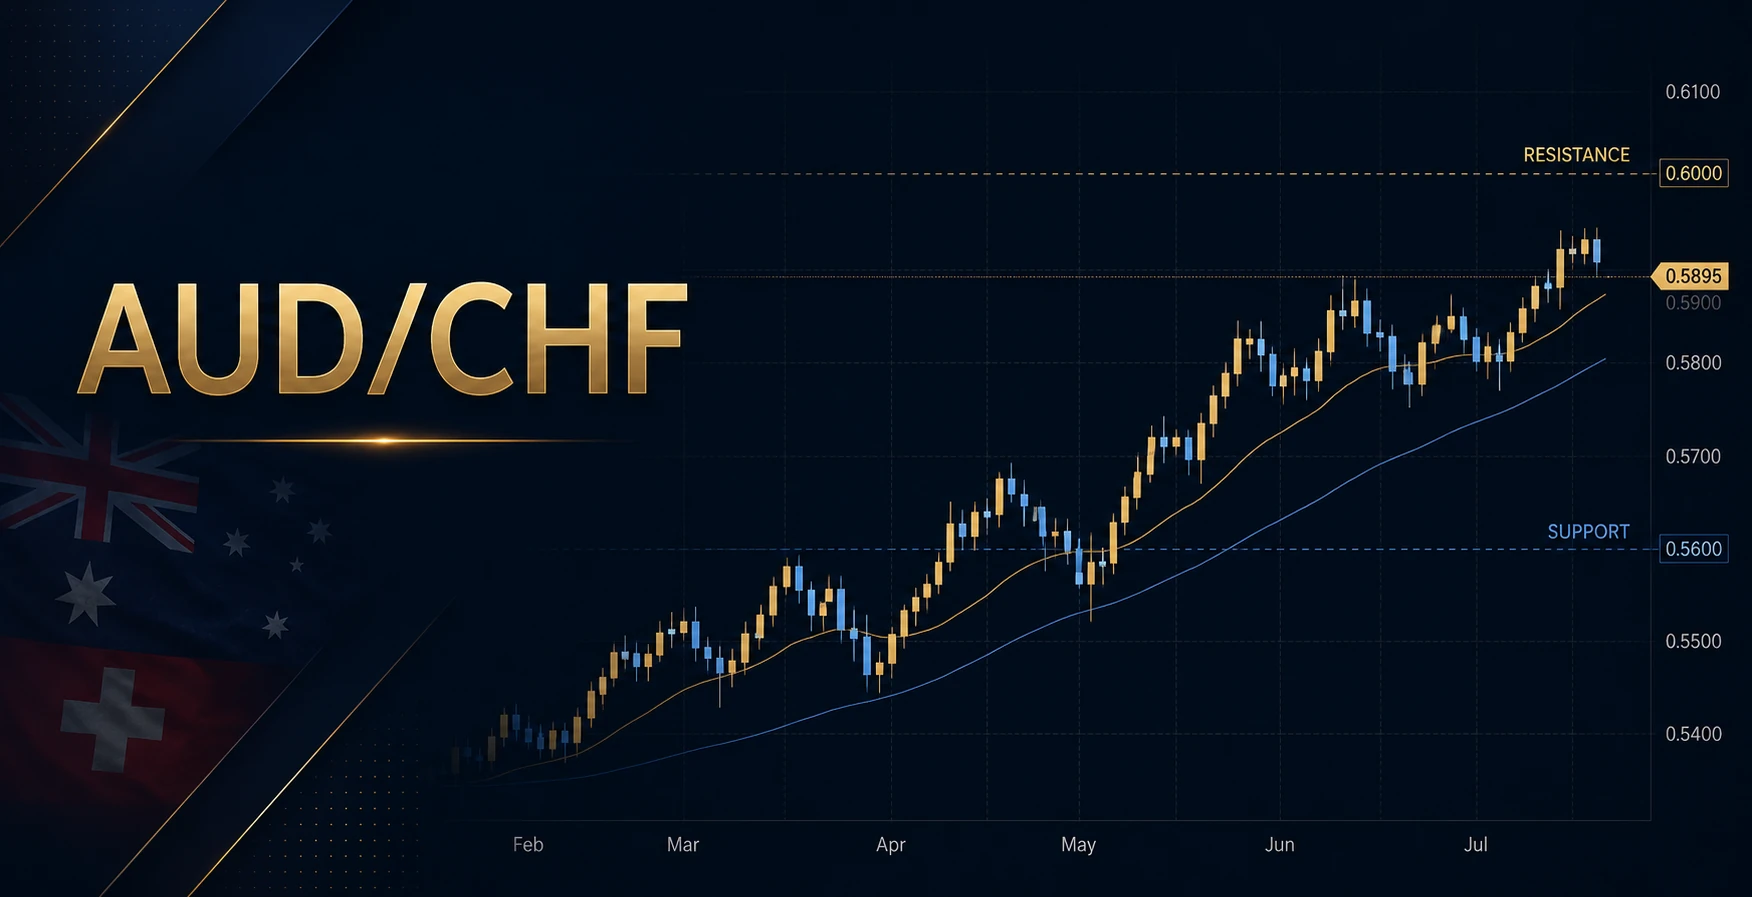
On the daily D1 chart, AUD/CHF has exhibited a steady upward trajectory, moving from recent swing lows toward a recent high near 0.58289 before closing at 0.58119. The recent sequence of higher daily closes highlights persistent buying interest, though price action is approaching critical structural resistance.
Key Technical Indicators:
Bollinger Bands: The daily Bollinger Bands are expanding, with the middle band situated at 0.575298, the lower band at 0.567605, and the upper band at 0.582991. The last close at 0.58119 trades near the upper band, indicating strong bullish momentum and heightened volatility.
RSI: The 14-day Relative Strength Index (RSI) stands at 66.93. Positioned in upper bullish territory below the overbought threshold of 70, the indicator suggests ongoing upward pressure while leaving room for potential price movement in either direction.
MACD: The daily MACD indicator is in positive territory with a reading of 0.003303. This positive value reflects underlying bullish momentum, as short-term moving averages remain positioned above longer-term baseline averages.
Support and Resistance:
Key technical levels for AUD/CHF on the daily timeframe include primary resistance at 0.58289 and a major support level below at 0.55481.
News to Watch for AUDCHF This Week:
- PPI m/m: This release tracks changes in producer prices, providing insights into wholesale inflation trends that could impact Swiss monetary policy expectations.
Weekly Outlook and Consideration:
The weekly outlook for AUD/CHF remains constructively bullish based on daily chart technicals. With price action near 0.58119, an RSI of 66.93, and a positive MACD of 0.003303, momentum favors buyers as price approaches upper Bollinger Band resistance at 0.582991. A sustained breakout above resistance at 0.58289 could extend upside progression, while any sudden pullbacks may see initial downside cushioned above technical support at 0.55481.
Disclaimer: The analysis provided for AUD/CHF is for informational purposes only and does not constitute investment advice. Traders are encouraged to perform their own analysis and research before making any trading decisions. Market conditions can change quickly, so staying informed with the latest data is essential.