Time Zone: GMT +3
Time Frame: Daily (D1) / Weekly Outlook
Weekly Fundamental Overview:
The USD/SGD pair continues to react to broader macroeconomic conditions affecting the US dollar and regional trade dynamics. Upcoming US economic releases, particularly decisions from the Federal Reserve regarding interest rates and economic growth forecasts, could trigger notable volatility for USDSGD during the week.
Price Action:
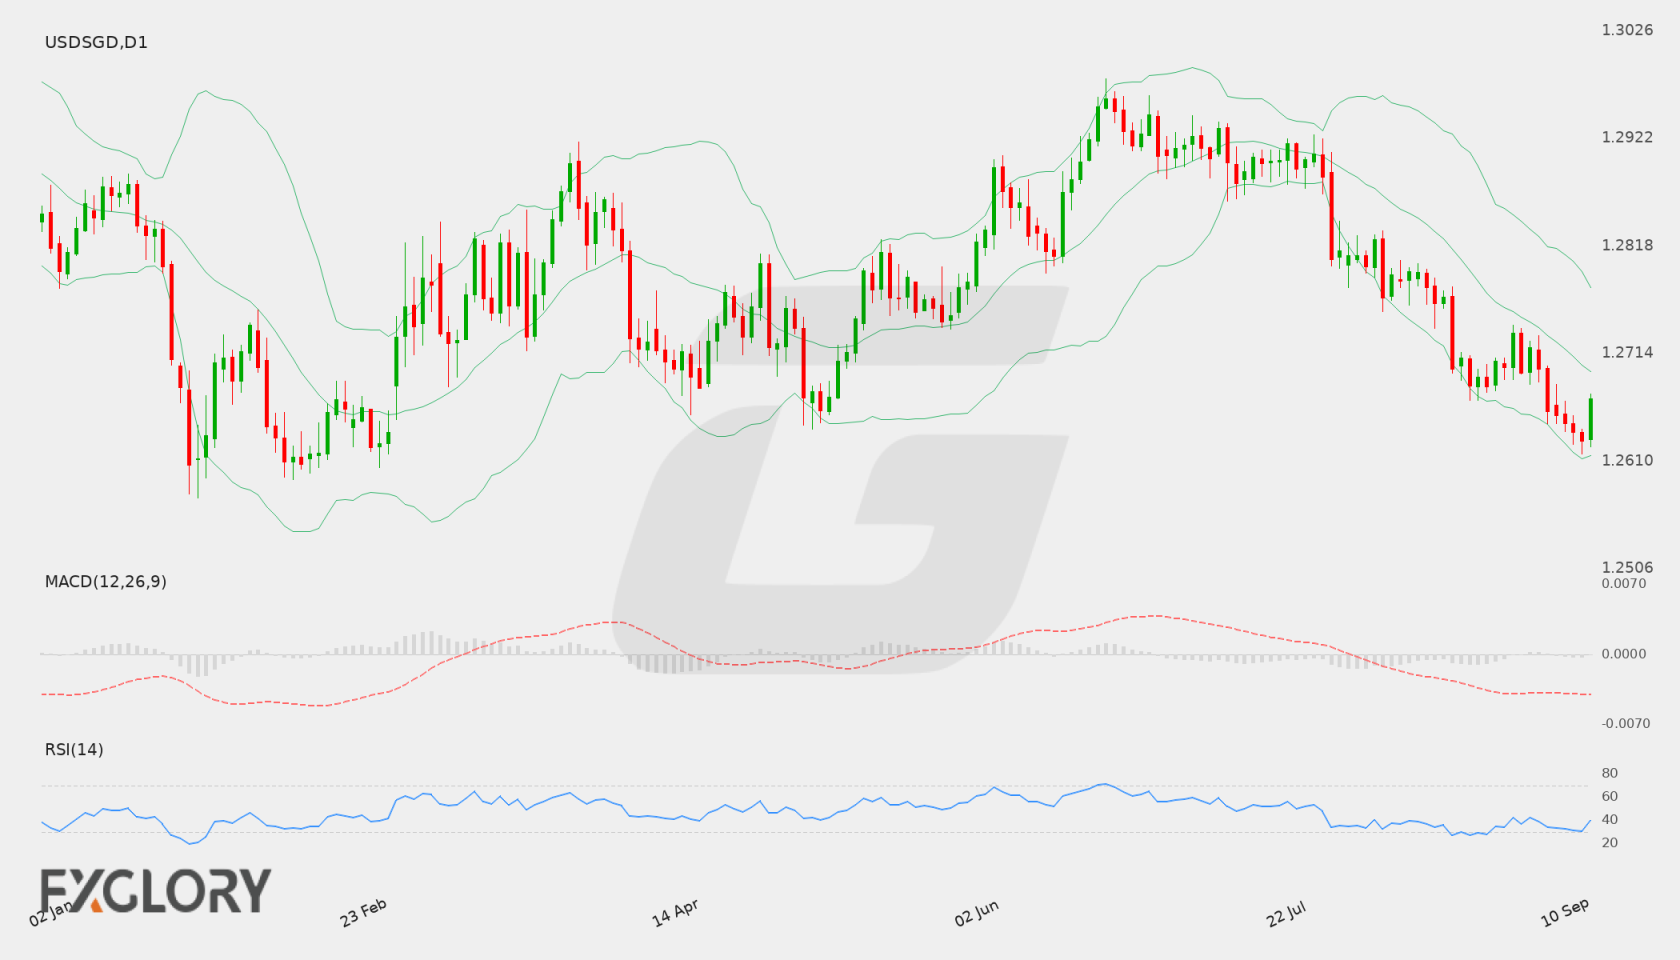
On the Daily (D1) timeframe, USD/SGD recently closed at 1.26701, recovering slightly after touching a low near 1.26300. The pair has experienced a persistent downtrend from recent peaks above 1.2900, remaining constrained below key dynamic resistance levels.
Key Technical Indicators:
Bollinger Bands: The Bollinger Bands indicator shows the middle band at 1.26968, acting as immediate overhead resistance. The upper band rests at 1.27783 while the lower band sits at 1.26153, indicating that price action is trading in the lower half of the band structure.
RSI: The 14-day Relative Strength Index (RSI) is recorded at 40.32, maintaining a position below the neutral 50 level. This signals prevailing weakness without yet breaching into deeply oversold territory.
MACD: The MACD indicator stands at -0.00412, remaining below the zero line. This negative reading reflects sustained downside momentum for USDSGD, though traders continue to watch for potential convergence signals.
Support and Resistance:
Immediate key support for USD/SGD is located around 1.26171, closely aligned with the lower Bollinger Band. On the upside, main resistance is identified at 1.29797, with intermediate resistance near the middle Bollinger band at 1.26968.
News to Watch for USDSGD This Week:
- Core Retail Sales m/m: This release measures consumer spending shifts which may influence US dollar momentum.
- Retail Sales m/m: Key consumer data can provide insights into overall economic activity affecting USD/SGD.
- FOMC Economic Projections: Updated projections offer potential signals regarding future monetary policy paths.
- FOMC Statement: Official policy statements can heavily impact market sentiment and exchange rate directions.
- Federal Funds Rate: The interest rate decision remains a primary catalyst for USD volatility.
- FOMC Press Conference: Executive commentary following the policy decision often drives sharp intraday moves.
- Unemployment Claims: Weekly labor market data offers fresh evidence of economic strength or weakness.
Weekly Outlook and Consideration:
The technical outlook for USD/SGD remains weighted to the downside as daily indicators like RSI and MACD stay depressed below neutral thresholds. Trading below the middle Bollinger band at 1.26968 keeps the focus on key support around 1.26171. However, major US economic announcements could alter short-term market direction, making risk management crucial if resistance at 1.29797 is tested.
Disclaimer: The analysis provided for USD/SGD is for informational purposes only and does not constitute investment advice. Traders are encouraged to perform their own analysis and research before making any trading decisions. Market conditions can change quickly, so staying informed with the latest data is essential.