
USDDKK Forecast

USD iconDKK icon
USD/DKK

US Dollar vs Danish Krone

USD/DKK Live Price

6.57154
+0.14%

USD/DKK Forecast — 20 September 2026

Time Zone: GMT +3

Time Frame: Daily (D1) / Weekly Outlook

Weekly Fundamental Overview:

The USD/DKK currency pair remains closely connected to economic developments in the United States and Eurozone stability due to the Danish Krone’s peg to the Euro. Shifts in macroeconomic expectations and central bank policy expectations drive broad movements in the exchange rate. Traded momentum reflects broader US Dollar dynamics alongside regional macroeconomic backdrop signals.

Price Action:

On the Daily (D1) chart, USD/DKK has demonstrated bullish price action, advancing from mid-6.42 levels to a close of 6.51066. Recent daily candles indicate strong buying interest that pushed price past the upper volatility boundary, though resistance remains overhead.

Key Technical Indicators:

Bollinger Bands: The Daily Bollinger Bands show a middle band at 6.43895, an upper band at 6.50264, and a lower band at 6.37526. With the recent close at 6.51066 positioned above the upper band, the pair reflects solid upward volatility expansion.

RSI: The 14-day Relative Strength Index (RSI) stands at 65.56, signaling strong bullish momentum while staying clear of extreme overbought territory above 70.

MACD: The Daily MACD indicator displays a positive reading of 0.00656, reinforcing ongoing upside momentum for USD/DKK on the daily timeframe.

Support and Resistance:

Key Daily technical levels for USD/DKK feature main resistance at 6.58056 and primary support at 6.37991. The Bollinger middle band at 6.43895 acts as an intermediate dynamic support area.

News to Watch for USDDKK This Week:

  • CB Consumer Confidence: Assesses consumer economic outlook which can influence US Dollar sentiment.
  • JOLTS Job Openings: Indicates labor market demand and potential employment conditions.
  • ADP Non-Farm Employment Change: Provides an early view of private sector employment growth.
  • Core PCE Price Index m/m: Serves as a primary inflation metric influencing monetary policy expectations.
  • Final GDP q/q: Measures overall economic performance and growth across the country.
  • ISM Manufacturing PMI: Reflects operational strength and conditions within the manufacturing sector.
  • Average Hourly Earnings m/m: Shows wage growth momentum that can feed into broader inflation.
  • Non-Farm Employment Change: Highlights key job creation data impacting market sentiment.
  • Unemployment Rate: Offers a snapshot of overall labor market health.

Weekly Outlook and Consideration:

The weekly outlook for USD/DKK maintains a bullish posture backed by Daily technical indicators. The RSI at 65.56 and positive MACD histogram reflect steady upward pressure, with price trading above the upper Bollinger Band of 6.50264. Should buyers hold control above 6.43895, the price may continue towards the resistance level at 6.58056. Conversely, a period of consolidation could lead to a test of lower support near 6.37991.

Disclaimer: The analysis provided for USD/DKK is for informational purposes only and does not constitute investment advice. Traders are encouraged to perform their own analysis and research before making any trading decisions. Market conditions can change quickly, so staying informed with the latest data is essential.
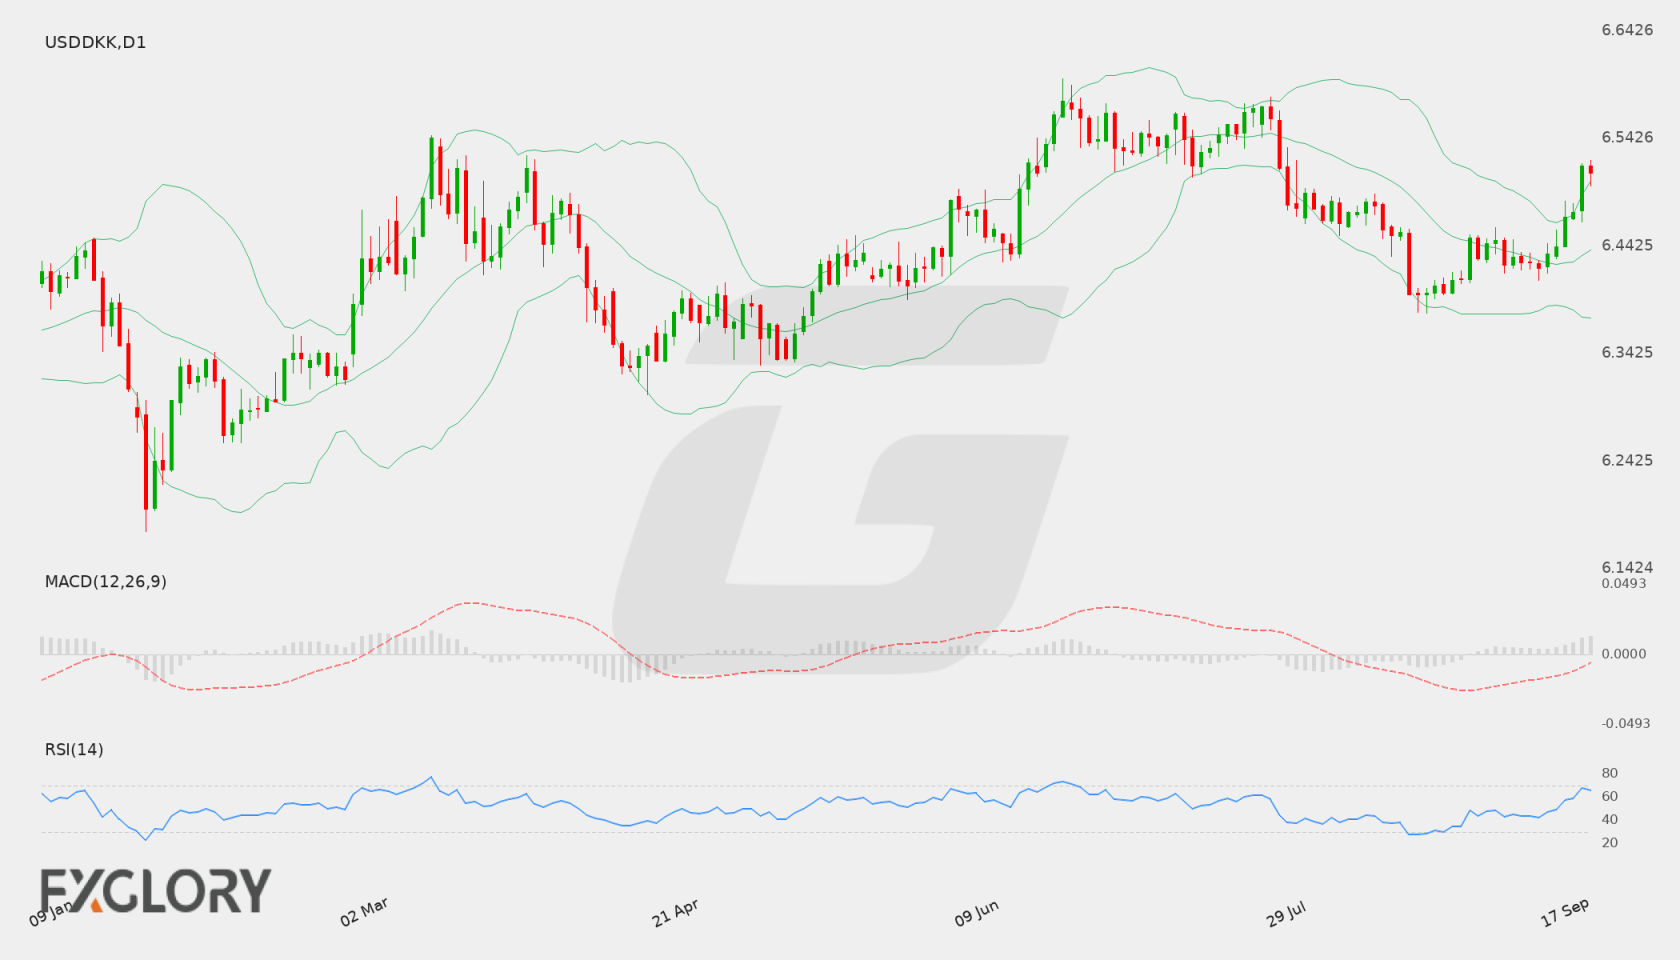
USD/DKK D1 technical analysis chart
USD/DKK D1 Technical Analysis for 09.20.2026

USD/DKK Forecast — 12 September 2026

Time Zone: GMT +3

Time Frame: Daily (D1) / Weekly Outlook

Weekly Fundamental Overview:

The USD/DKK currency pair continues to trade within a structured range as market participants evaluate broader economic drivers impacting both the US dollar and the Danish krone. Fundamental focus remains tied to monetary policy dynamics and macroeconomic releases that could influence interest rate expectations for both currencies.

Price Action:

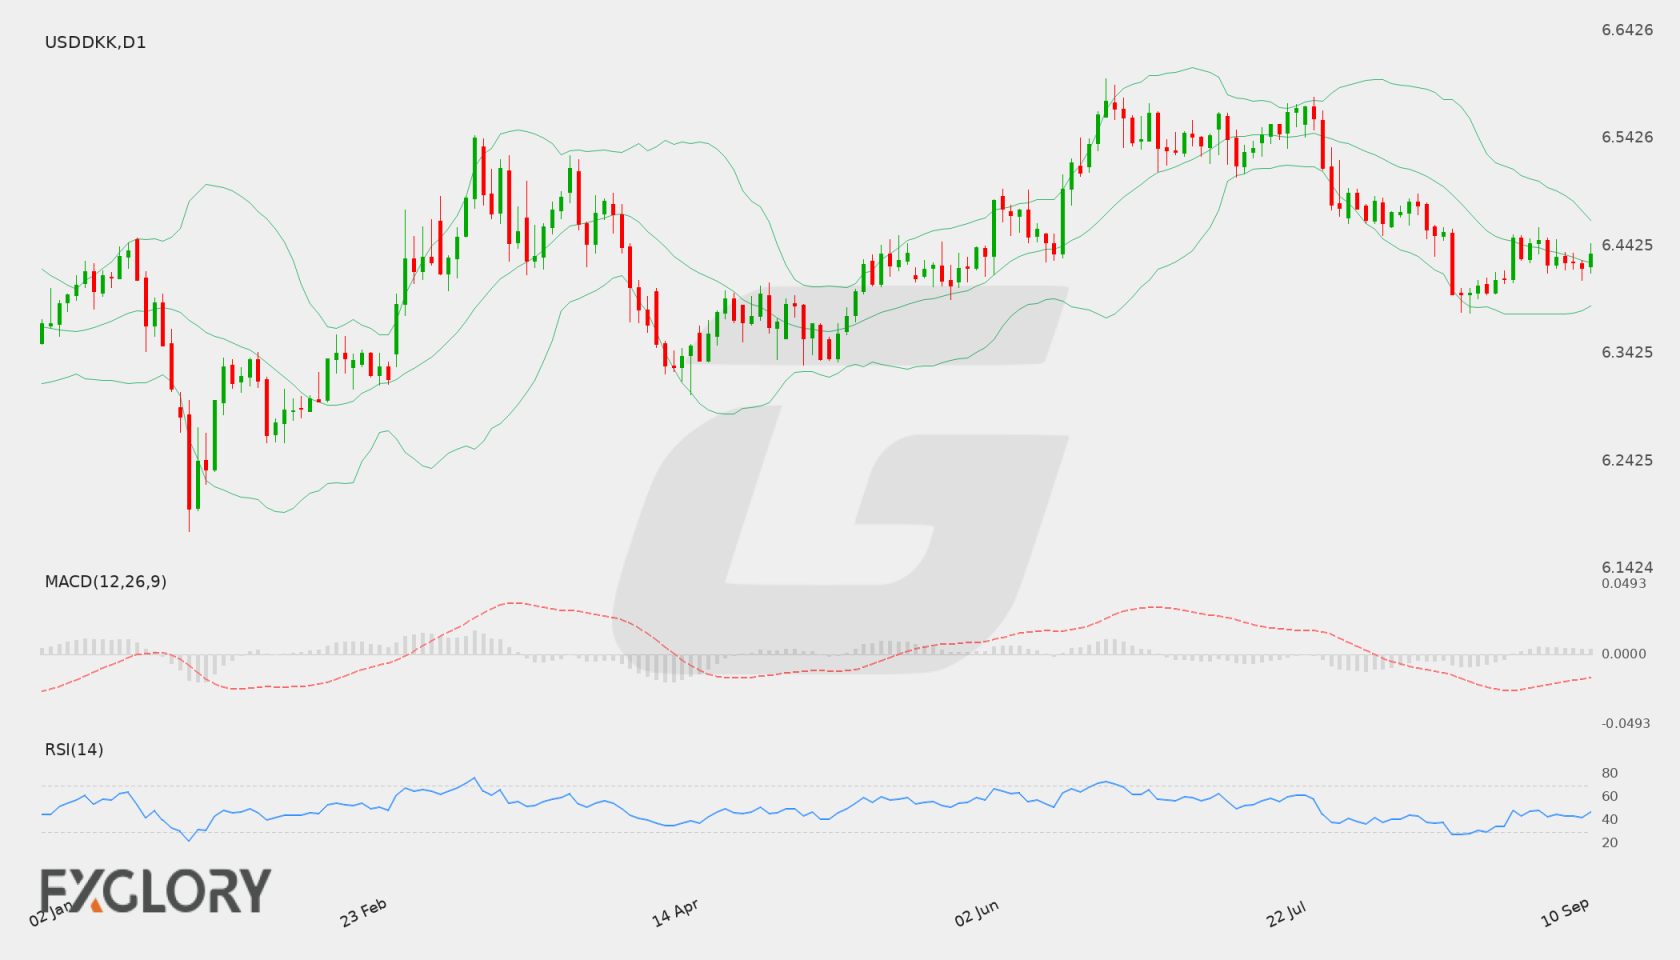
Daily (D1) price action for USD/DKK shows the pair holding near recent consolidation levels, closing at 6.43493. Recent daily candlesticks reflect modest fluctuations around the middle boundary, indicating a period of balanced market activity following prior moves.

Key Technical Indicators:

Bollinger Bands: The Bollinger Bands indicator on the daily chart places the middle band at 6.42643, with the upper band at 6.46649 and the lower band at 6.38636. Trading at 6.43493 positions the pair slightly above the middle band, reflecting a neutral volatility environment.

RSI: The 14-day Relative Strength Index (RSI14) currently stands at 46.71. Positioned in neutral territory below the 50 level, the RSI reflects an absence of strong directional bias and no overbought or oversold conditions.

MACD: The MACD indicator on the D1 chart prints a negative value of -0.01275. This negative reading highlights lingering downside momentum, although the histogram suggests momentum has stabilized over recent sessions.

Support and Resistance:

Key technical levels on the daily chart identify primary support at 6.37991 and key resistance at 6.59788. Additional dynamic boundaries are defined by the lower Bollinger Band at 6.38636 and the upper band at 6.46649.

News to Watch for USDDKK This Week:

  • Core Retail Sales m/m: Measures core consumer spending performance which can impact US dollar valuation.
  • Retail Sales m/m: Offers key insights into overall consumer spending and domestic economic momentum.
  • FOMC Economic Projections: Outlines official forecasts for economic growth and inflation influencing monetary expectations.
  • FOMC Statement: Details official monetary policy decisions and central bank economic assessments.
  • Federal Funds Rate: Establishes benchmark interest rates affecting yield differentials and market volatility.
  • FOMC Press Conference: Provides verbal guidance from monetary officials regarding future policy direction.
  • Unemployment Claims: Tracks weekly changes in jobless filings to gauge labor market resilience.

Weekly Outlook and Consideration:

The weekly outlook for USD/DKK indicates a neutral-to-consolidative posture. With the daily close at 6.43493 positioned between support at 6.37991 and resistance at 6.59788, momentum indicators such as the RSI (46.71) and MACD (-0.01275) suggest a cautious environment. Movements toward the upper Bollinger Band at 6.46649 or the lower band at 6.38636 will remain important focal points alongside key US macroeconomic developments.

Disclaimer: The analysis provided for USD/DKK is for informational purposes only and does not constitute investment advice. Traders are encouraged to perform their own analysis and research before making any trading decisions. Market conditions can change quickly, so staying informed with the latest data is essential.
USD/DKK D1 technical analysis chart
USD/DKK D1 Technical Analysis for 09.12.2026

USD/DKK Forecast — 5 September 2026

Time Zone: GMT +3

Time Frame: Daily (D1) / Weekly Outlook

Weekly Fundamental Overview:

The USD/DKK currency pair remains strongly influenced by US dollar market dynamics and Eurozone monetary policy developments, given the Danish Krone’s fixed peg to the Euro. Market participants are closely watching upcoming US inflation reports and economic sentiment indicators to gauge the direction of interest rate expectations and overall currency strength.

Price Action:

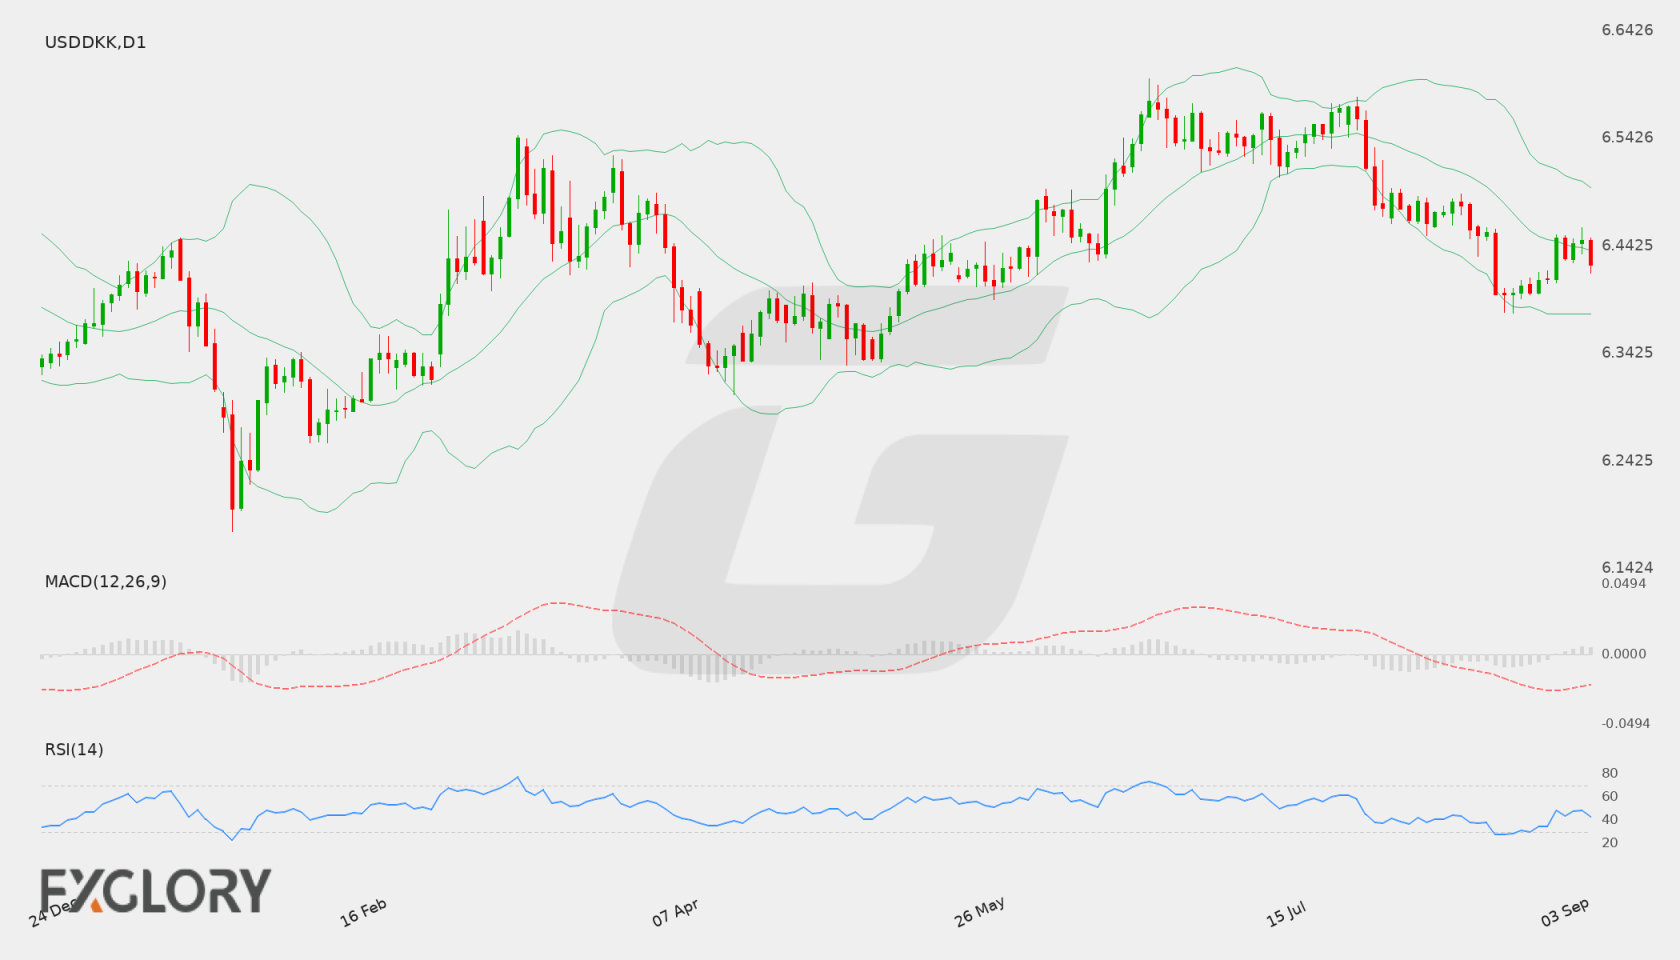
On the Daily (D1) chart, USD/DKK recently closed at 6.42560 after retreating from a high of 6.44962 earlier in the session sequence. The pair continues to consolidate within a defined range, exhibiting muted directional momentum following recent fluctuations.

Key Technical Indicators:

Bollinger Bands: The Bollinger Bands indicator shows a middle band at 6.43798, an upper band at 6.49667, and a lower band at 6.37930. The current price of 6.42560 trades just beneath the middle line, signaling a neutral to slightly suppressed volatility profile.

RSI: The 14-day Relative Strength Index (RSI) stands at 42.61. Operating below the midpoint of 50, the reading suggests mild bearish sentiment while holding well above oversold territory.

MACD: The MACD indicator is currently registering at -0.01711, remaining below the signal line in negative territory. This indicates that underlying momentum leans moderately to the downside for USD/DKK in the short term.

Support and Resistance:

Key daily chart levels place immediate support at 6.37991, aligned closely with the lower Bollinger Band. Stronger overhead resistance is positioned at 6.59788, which defines the upper ceiling of the current broader range.

News to Watch for USDDKK This Week:

  • PPI m/m: Tracks monthly producer inflation changes that provide early signals for consumer price trends.
  • Core PPI m/m: Measures wholesale price movements excluding volatile food and energy components to show underlying inflation pressures.
  • Unemployment Claims: Provides regular updates on labor market performance and overall economic health.
  • Core CPI m/m: Evaluates consumer price changes excluding food and energy to inform policy outlooks.
  • CPI y/y: Reflects annual headline inflation trends that impact interest rate expectations.
  • Core CPI y/y: Highlights long-term consumer price growth trends essential for assessing underlying inflation.
  • CPI m/m: Captures month-over-month shifts in consumer purchasing costs influencing short-term market volatility.
  • Prelim UoM Inflation Expectations: Shows consumer forecasts for future price increases that shape economic outlooks.
  • Prelim UoM Consumer Sentiment: Offers critical insight into consumer confidence and spending capability across the economy.

Weekly Outlook and Consideration:

The weekly technical setup for USD/DKK points to a balanced market with mild bearish tilt. With MACD at -0.01711 and RSI at 42.61, price action remains capped below the middle Bollinger Band at 6.43798. A sustained push lower could test key support around 6.37991. Conversely, if buyers regain control, price could attempt a recovery back toward upper resistance at 6.59788, with upcoming high-impact economic data likely acting as the catalyst.

Disclaimer: The analysis provided for USD/DKK is for informational purposes only and does not constitute investment advice. Traders are encouraged to perform their own analysis and research before making any trading decisions. Market conditions can change quickly, so staying informed with the latest data is essential.
USD/DKK D1 technical analysis chart
USD/DKK D1 Technical Analysis for 09.05.2026

USD/DKK Forecast — 29 August 2026

Time Zone: GMT +3

Time Frame: Daily (D1) / Weekly Outlook

Weekly Fundamental Overview:

The USD/DKK currency pair has recently experienced downward pressure as market participants weigh economic conditions in the United States against European macroeconomic trends. Upcoming US economic releases, particularly around manufacturing and labor conditions, are expected to play a critical role in shaping market expectations regarding interest rate trajectory and dollar demand for the USDDKK pair.

Price Action:

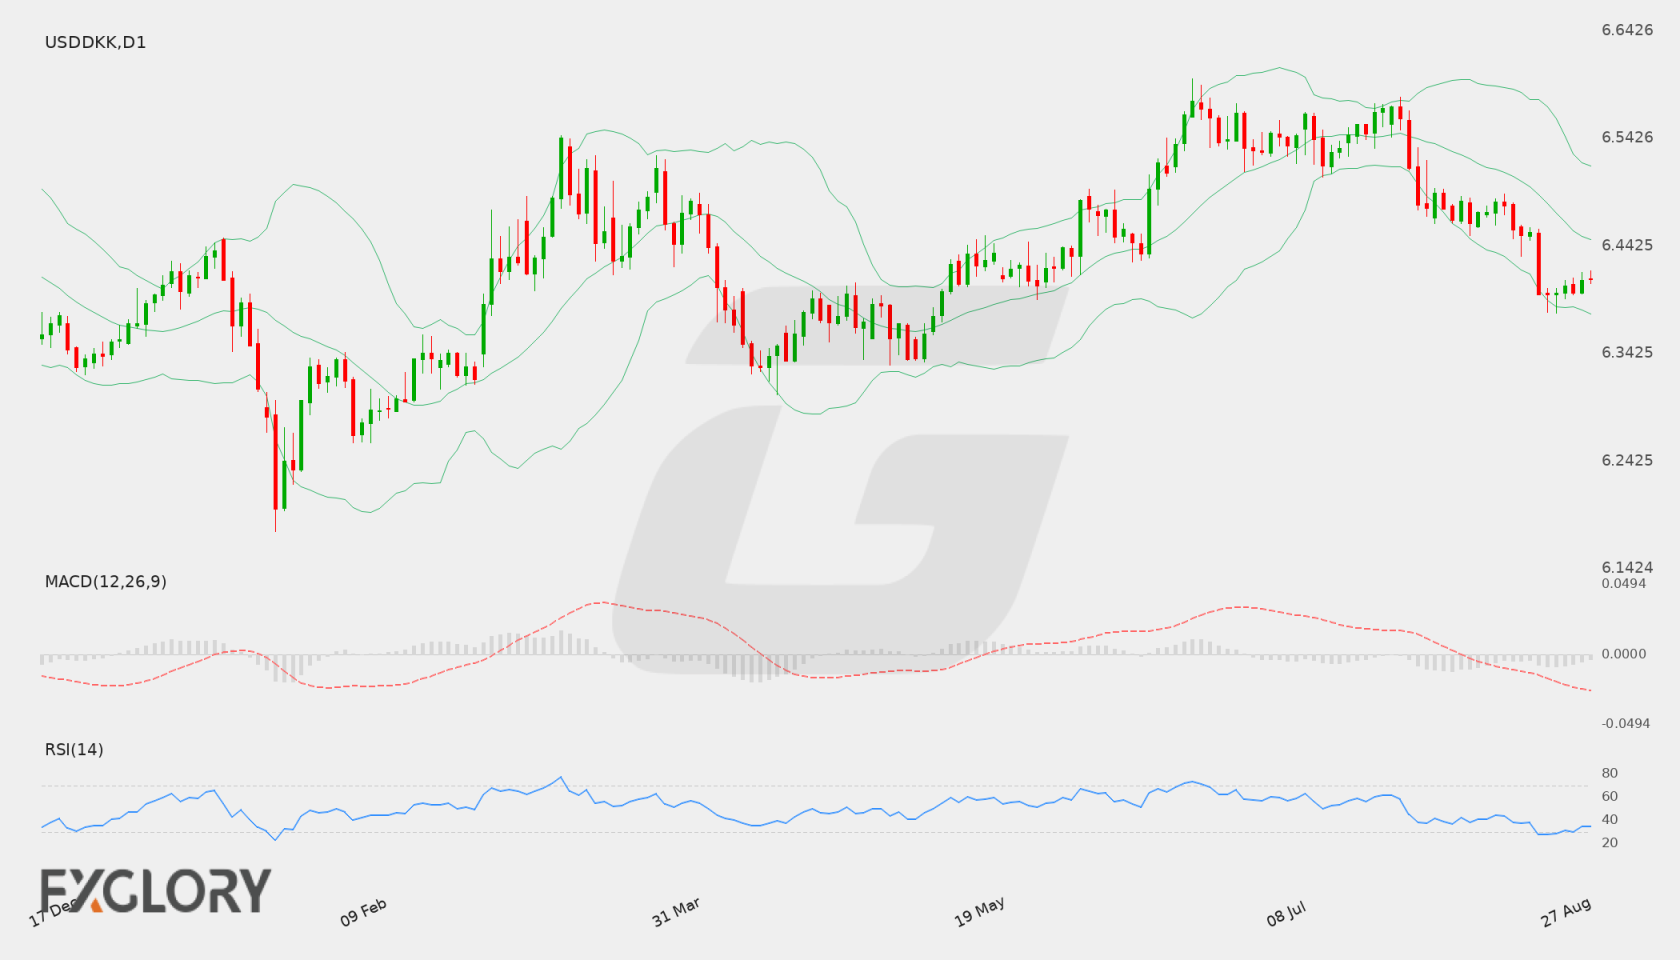
On the daily D1 chart, USD/DKK closed its latest trading session at 6.41154. Following a sustained decline from multi-week highs, price action has shown signs of stabilization near recent swing lows around 6.39700. The currency pair is attempting a minor bounce, though overall price structures remain constrained below key moving averages.

Key Technical Indicators:

Bollinger Bands: The Bollinger Bands indicator on the daily chart shows a middle band at 6.44801, an upper band at 6.51704, and a lower band at 6.37897. USD/DKK is currently trading near the lower boundary of the envelope, reflecting recent bearish momentum while remaining within the bands as volatility stabilizes.

RSI: The 14-day Relative Strength Index (RSI) is recorded at 34.70. This level positions the indicator near oversold territory, signaling significant selling pressure in recent sessions while leaving room for potential consolidation or a brief corrective move.

MACD: The MACD indicator stands at -0.02922, operating below the zero line. This negative value reflects ongoing bearish momentum over the daily period, though flattening histogram bars suggest that downside momentum may be decelerating.

Support and Resistance:

Key technical levels for USD/DKK on the daily chart include established support at 6.37991 and primary resistance at 6.59788. A break below immediate support could expose lower territory, whereas sustained gains above resistance would be required to shift the broader trend outlook.

News to Watch for USDDKK This Week:

  • ISM Manufacturing PMI: Assesses activity in the US manufacturing sector, which can significantly influence USD sentiment.
  • JOLTS Job Openings: Measures monthly job openings to gauge labor market tightness and overall economic health.
  • ISM Manufacturing Prices: Highlights inflationary pressures within the manufacturing sector affecting monetary policy expectations.
  • ADP Non-Farm Employment Change: Provides an early look at private-sector employment additions, impacting expectations for official labor reports.
  • ISM Services PMI: Evaluates growth in the dominant service sector, offering insights into broader economic momentum.
  • Non-Farm Employment Change: Reflects total payroll expansion, serving as a primary catalyst for USD volatility.
  • Unemployment Rate: Indicates labor market capacity and overall economic strength, impacting Federal Reserve policy expectations.
  • Average Hourly Earnings m/m: Tracks wage inflation trends, influencing consumer spending and monetary policy outlooks.

Weekly Outlook and Consideration:

The weekly outlook for USD/DKK remains cautious following a retreat toward the 6.39700 zone. With the pair trading near its lower Bollinger Band at 6.37897 and an RSI of 34.70, selling momentum has shown signs of slowing. However, with the MACD remaining below the zero mark at -0.02922 and price action holding below the middle band at 6.44801, buyers need to push above interim resistance to signal a genuine reversal. Market volatility will likely depend heavily on incoming economic releases.

Disclaimer: The analysis provided for USD/DKK is for informational purposes only and does not constitute investment advice. Traders are encouraged to perform their own analysis and research before making any trading decisions. Market conditions can change quickly, so staying informed with the latest data is essential.

USD/DKK D1 technical analysis chart
USD/DKK D1 Technical Analysis for 08.29.2026

USD/DKK Forecast — 22 August 2026

Time Zone: GMT +3

Time Frame: Daily (D1) / Weekly Outlook

Weekly Fundamental Overview:

The USD/DKK currency pair remains sensitive to shifting macroeconomic trends in the United States alongside broader risk sentiment. Market participants continue to evaluate monetary policy prospects and economic growth metrics, which directly influence demand for the US Dollar against the Danish Krone. Upcoming economic releases from the US could add volatility to the exchange rate as traders assess interest rate expectations.

Price Action:

On the daily (D1) chart, USD/DKK has experienced a distinct downward trajectory over recent sessions, sliding from recent highs near 6.5700 down to a close of 6.39745. The extended series of lower closes reflects persistent selling pressure, bringing price action into proximity with lower technical support zones.

Key Technical Indicators:

Bollinger Bands: The Bollinger Bands indicator highlights active downside volatility for USD/DKK. The middle band (20-day simple moving average) sits at 6.48180, with the upper band at 6.57194 and the lower band at 6.39165. The recent close of 6.39745 trades right near the lower band, indicating strong bearish pressure while approaching band boundary boundaries.

RSI: The 14-day Relative Strength Index (RSI) currently prints at 27.54. This reading places the USD/DKK pair in oversold territory below the 30 threshold, which signals intense downward momentum and potential for a pause or consolidation if selling pressure wanes.

MACD: The Moving Average Convergence Divergence (MACD) indicator confirms dominant downside momentum for USD/DKK. The MACD value stands at -0.02604, remaining below the zero line and signaling sustained negative momentum across daily timeframes.

Support and Resistance:

Key technical levels for USD/DKK feature immediate horizontal support at 6.38024. On the upside, primary technical resistance is located at 6.59788, with intermediate resistance marked by the 20-day moving average near 6.48180.

News to Watch for USDDKK This Week:

  • CB Consumer Confidence: Shifts in consumer confidence could influence general sentiment around the US dollar.
  • Core PCE Price Index m/m: This inflation metric can impact Federal Reserve policy expectations and currency market valuation.
  • Prelim GDP q/q: Preliminary economic growth figures offer key insights into broad US economic performance.
  • Prelim GDP Price Index q/q: Broader price trends within gross domestic product affect market inflation assessments.
  • Unemployment Claims: Weekly labor market updates provide immediate signals on employment health.
  • Prelim Benchmark Payrolls Revision: Revisions to historic payroll data can shift expectations regarding overall labor market momentum.

Weekly Outlook and Consideration:

The weekly outlook for USD/DKK leans bearish technically, as price action trades near the lower Bollinger Band of 6.39165 and close to main support at 6.38024. Negative MACD values (-0.02604) reinforce the prevailing downtrend. However, with the daily RSI deep in oversold territory at 27.54, short-term pullbacks or sideways consolidation may occur if support holds. A break below support could open further downside, while a recovery would face initial resistance toward the middle band at 6.48180.

Disclaimer: The analysis provided for USD/DKK is for informational purposes only and does not constitute investment advice. Traders are encouraged to perform their own analysis and research before making any trading decisions. Market conditions can change quickly, so staying informed with the latest data is essential.

1USD = –––DKK –––% ▼
USDDKK
Loading chart...