
EURSEK Forecast

EUR/SEK Forecast — 20 September 2026

Time Zone: GMT +3

Time Frame: Daily (D1) / Weekly Outlook

Weekly Fundamental Overview:

The EUR/SEK pair reflects ongoing macroeconomic developments within the Eurozone alongside economic conditions in Sweden. Key inflation metrics across Europe remain central to evaluating currency strength and monetary policy expectations, shaping the broader context for the currency pair.

Price Action:

On the daily D1 chart, EUR/SEK has exhibited a distinct upward move from recent consolidated levels, advancing toward a high of 11.30688 before consolidating to a last close of 11.26868. Higher daily lows over recent sessions indicate sustained buying interest within the prevailing trend.

Key Technical Indicators:

Bollinger Bands: The daily Bollinger Bands highlight an expanding structure, with the middle band positioned at 11.15621, the lower band at 10.99527, and the upper band at 11.31715. Trading close to the upper band underscores strong upward momentum in recent price action.

RSI: The 14-period RSI sits at 67.65, indicating prevailing bullish momentum while approaching the overbought threshold of 70.

MACD: The daily MACD indicator displays a positive value of 0.06346, demonstrating solid bullish momentum as the histogram remains above the zero line.

Support and Resistance:

Immediate key resistance for EUR/SEK is established at 11.31393, while technical support is grounded near 10.91464. Additional dynamic levels include the middle Bollinger Band at 11.15621.

News to Watch for EURSEK This Week:

  • German Prelim CPI m/m: This release offers insights into German inflation dynamics that could affect sentiment toward the euro.
  • CPI Flash Estimate y/y: This report measures headline inflation across the Eurozone and can influence currency valuations.
  • Core CPI Flash Estimate y/y: This data tracks underlying consumer price trends excluding volatile items to gauge monetary conditions.

Weekly Outlook and Consideration:

The overall technical structure for EUR/SEK on the daily chart favors the bullish side, as indicated by an RSI of 67.65 and a positive MACD reading of 0.06346. Price remains near the upper Bollinger Band at 11.31715. A sustained move above resistance at 11.31393 could extend the bullish trajectory, whereas a pullback toward the middle band at 11.15621 may serve as potential support before testing deeper levels near 10.91464.

Disclaimer: The analysis provided for EUR/SEK is for informational purposes only and does not constitute investment advice. Traders are encouraged to perform their own analysis and research before making any trading decisions. Market conditions can change quickly, so staying informed with the latest data is essential.
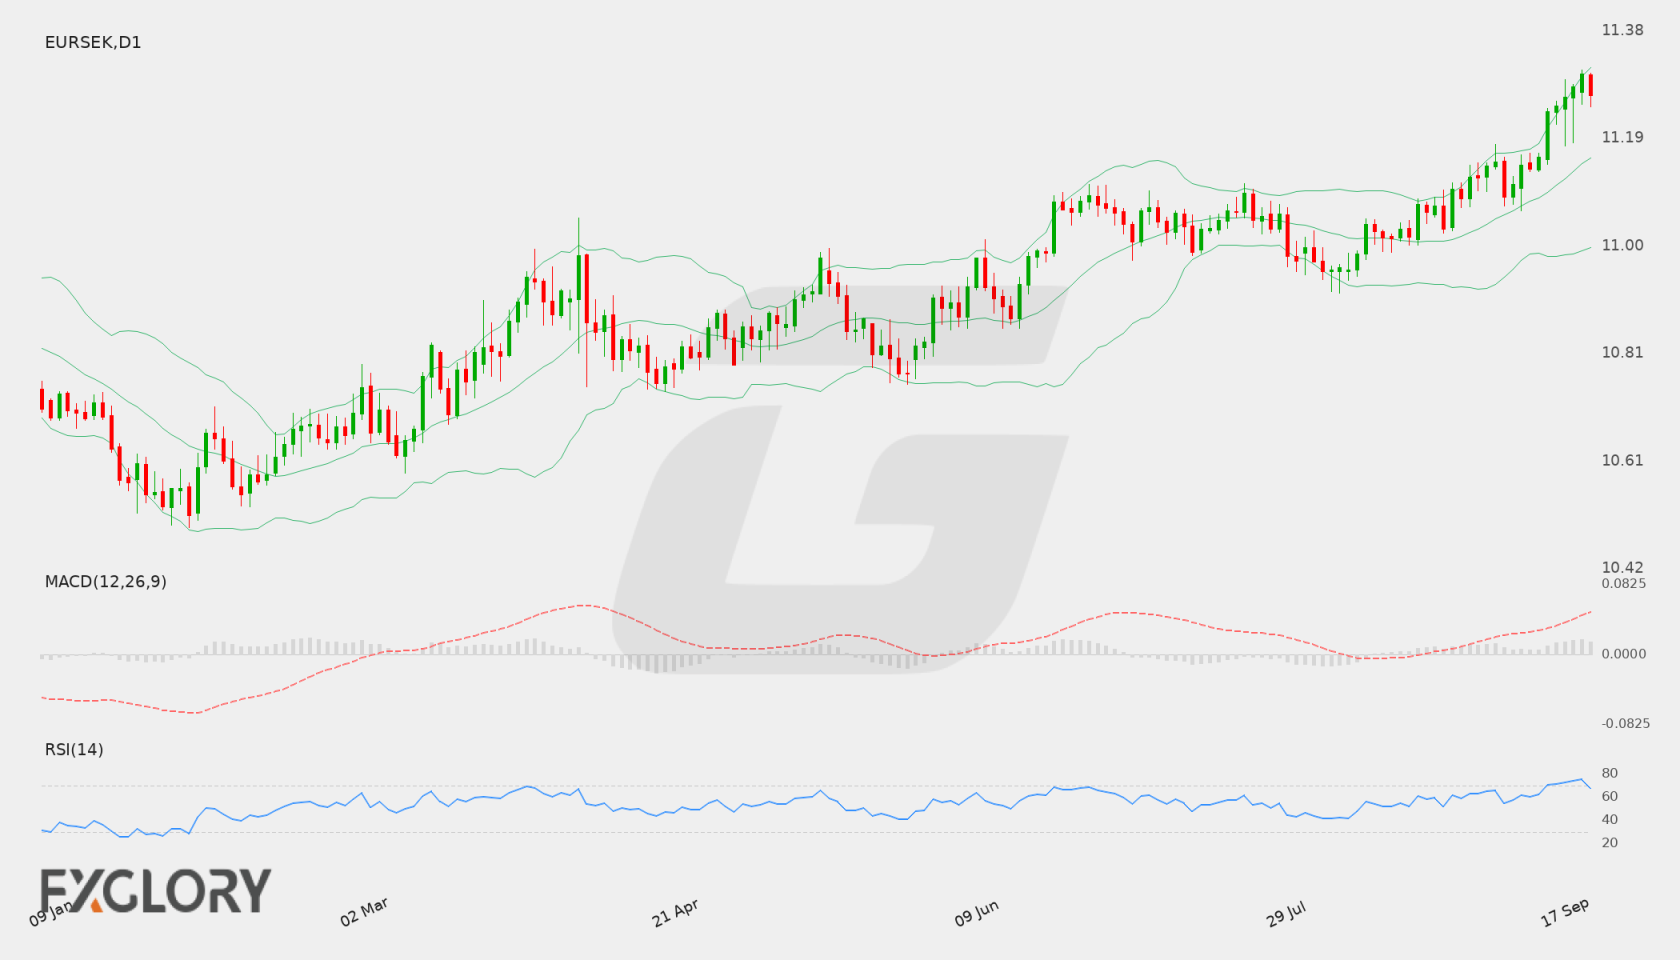
EUR/SEK D1 technical analysis chart
EUR/SEK D1 Technical Analysis for 09.20.2026

EUR/SEK Forecast — 12 September 2026

Time Zone: GMT +3

Time Frame: Daily (D1) / Weekly Outlook

Weekly Fundamental Overview:

natural fundamental dynamics for EUR/SEK (EURSEK) continue to be shaped by macroeconomic conditions across the Eurozone and Sweden. Market participants monitor incoming economic statistics to gauge economic health and potential monetary policy directions from regional central banks.

Price Action:

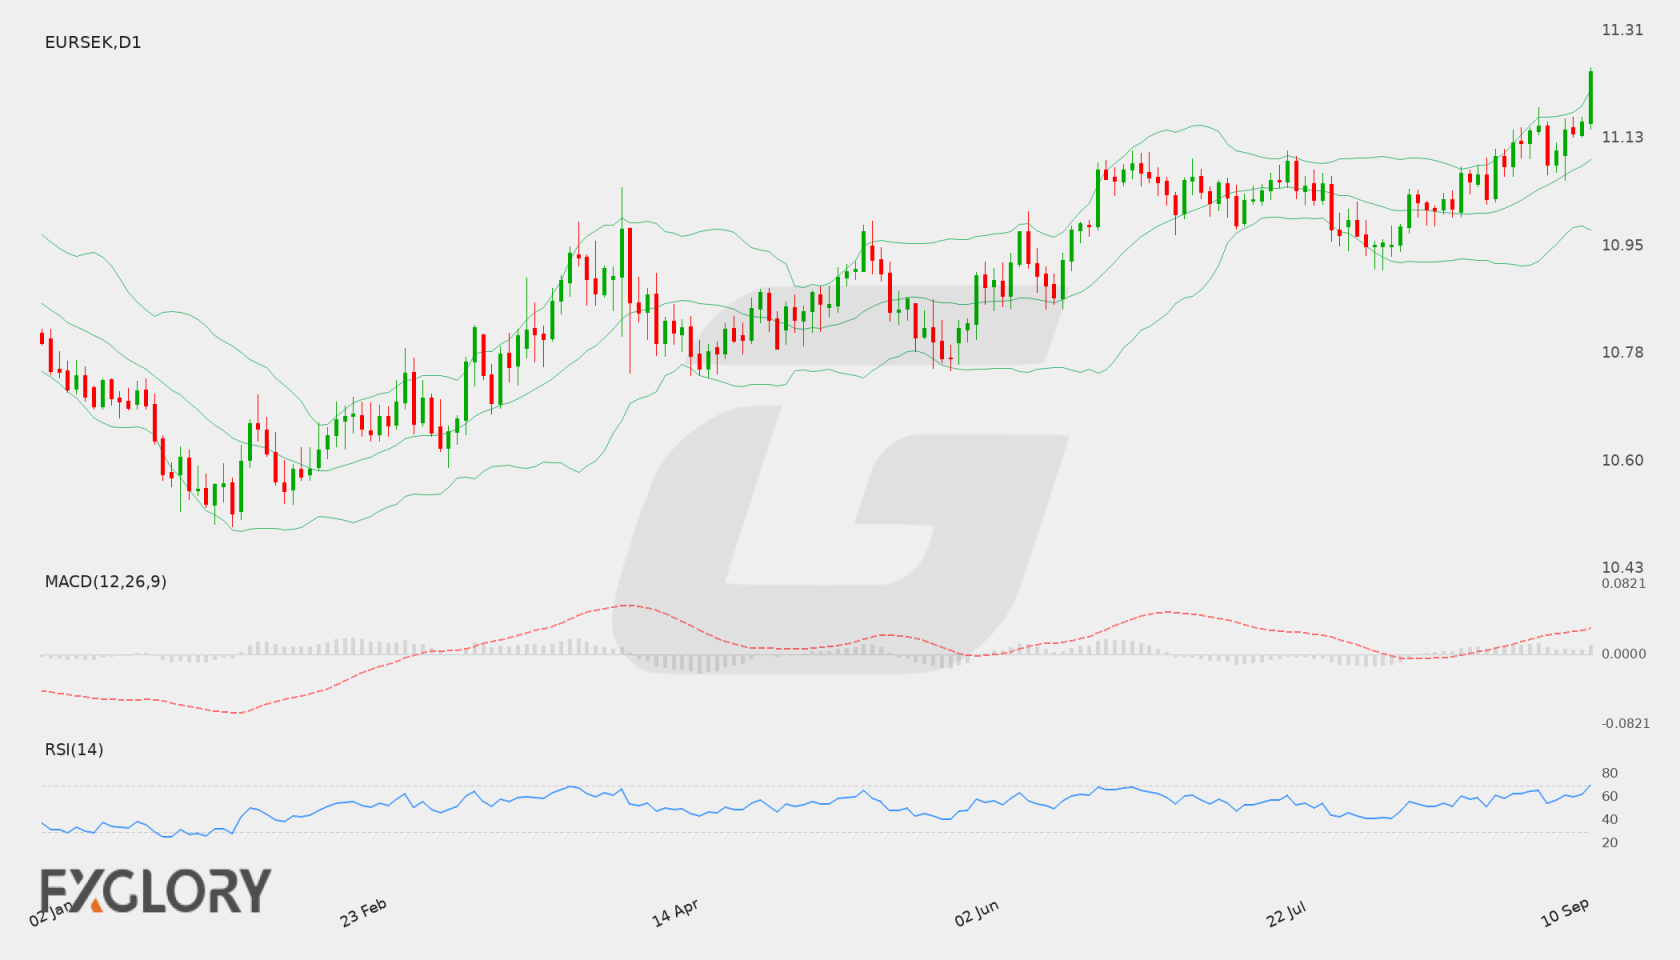
On the Daily (D1) timeframe, EUR/SEK has experienced a strong upward move, advancing from recent low periods near 10.95575 to close at 11.23846. The pair has demonstrated sustained bullish price action, pushing up close to key structural resistance levels.

Key Technical Indicators:

Bollinger Bands: The Bollinger Bands display a middle line at 11.09484, an upper band at 11.20974, and a lower band at 10.97993. EUR/SEK is currently trading above the upper band at 11.23846, highlighting a strong bullish expansion beyond the standard volatility range.

RSI: The 14-day RSI stands at 70.2107, positioning the index inside overbought territory. This high level reflects strong upside pressure over recent sessions while cautioning that momentum may face consolidation.

MACD: The MACD indicator is currently registering a positive value of 0.04067. This reading confirms positive momentum as short-term price movement remains elevated above longer-term averages.

Support and Resistance:

EUR/SEK is currently testing immediate technical resistance at 11.24475. On the downside, key support is established at 10.91464, with the middle Bollinger Band at 11.09484 serving as an intermediate reference point.

News to Watch for EURSEK This Week:

  • French Flash Manufacturing PMI: This release reflects purchasing managers sentiment in France and can impact wider expectations for European growth.
  • French Flash Services PMI: This survey assesses business conditions in the French services sector and offers insight into Eurozone domestic demand.
  • German Flash Manufacturing PMI: This indicator tracks manufacturing health in Germany and provides key signals regarding economic momentum in the euro area.

Weekly Outlook and Consideration:

EUR/SEK enters the upcoming week trading near its key resistance level of 11.24475 after closing at 11.23846. Technical indicators show robust bullish momentum, highlighted by a positive MACD of 0.04067 and price trading above the upper Bollinger Band at 11.20974. However, with the 14-day RSI at 70.2107 entering overbought territory, price action may encounter overhead pressure near resistance or experience potential consolidation. Traders will be watching how price responds around the 11.24475 zone alongside upcoming economic data.

Disclaimer: The analysis provided for EUR/SEK is for informational purposes only and does not constitute investment advice. Traders are encouraged to perform their own analysis and research before making any trading decisions. Market conditions can change quickly, so staying informed with the latest data is essential.
EUR/SEK D1 technical analysis chart
EUR/SEK D1 Technical Analysis for 09.12.2026

EUR/SEK Forecast — 5 September 2026

Time Zone: GMT +3

Time Frame: Daily (D1) / Weekly Outlook

Weekly Fundamental Overview:

The fundamental driver for EUR/SEK in the coming sessions centres around central bank policy decisions and economic indicators from the Eurozone, which directly influence euro sentiment against the Swedish Krona. Market participants will monitor incoming economic releases and interest rate guidance to gauge the monetary policy path and overall risk appetite.

Price Action:

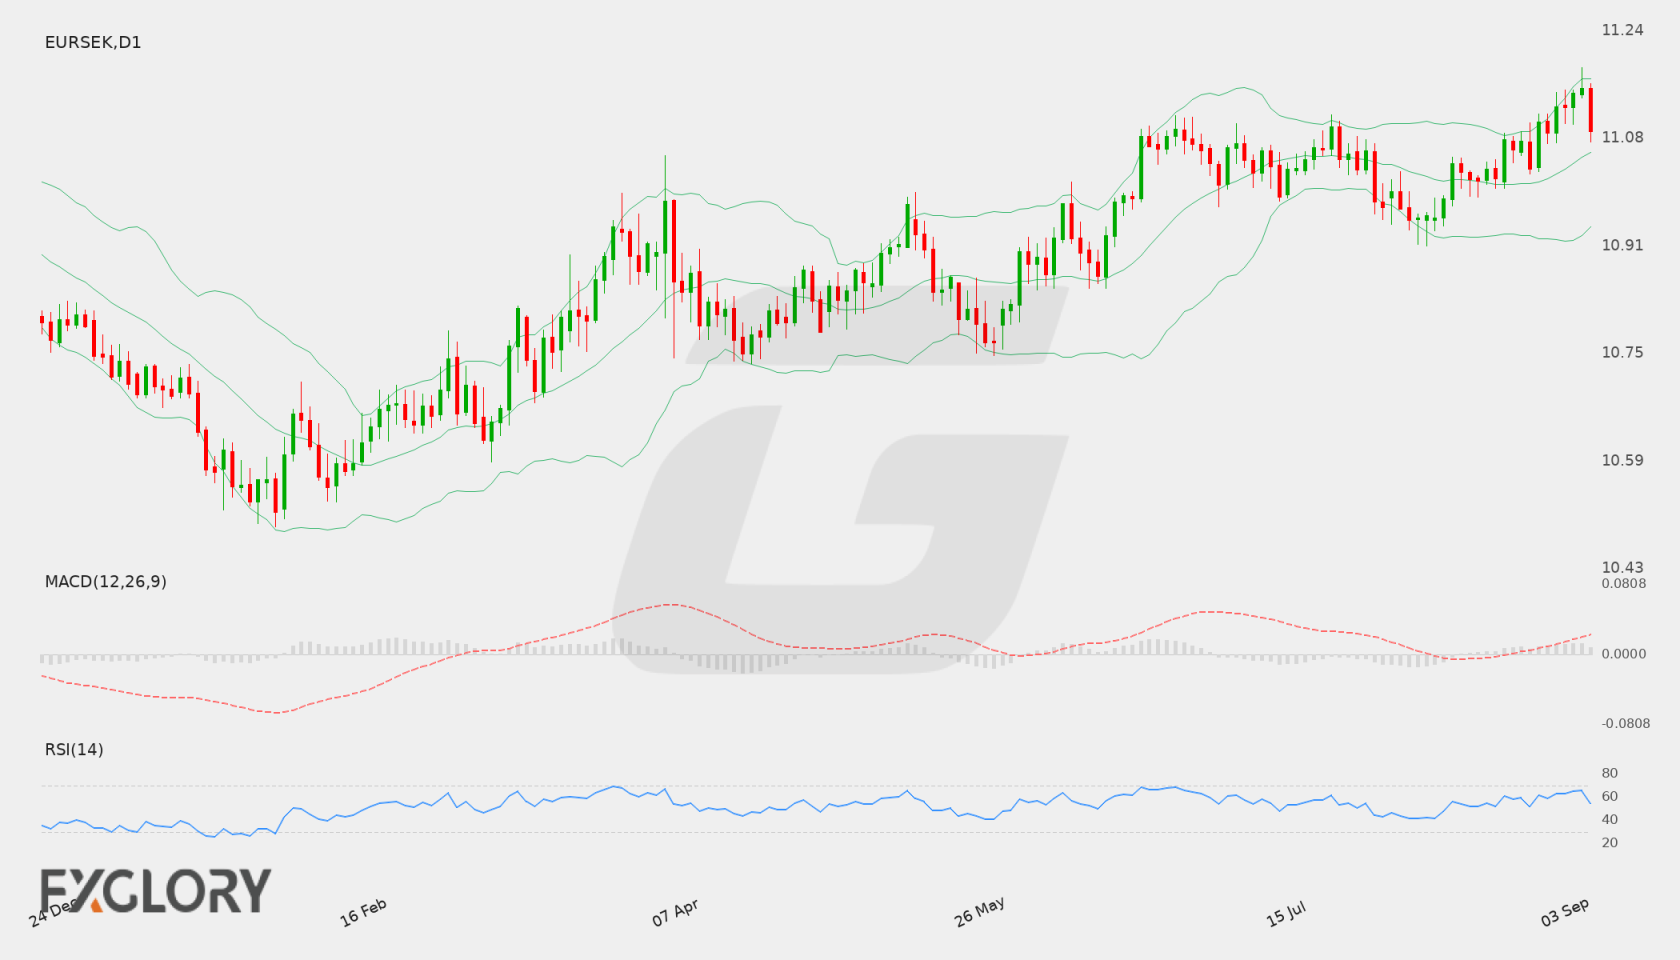
On the daily D1 chart, EUR/SEK reached a high of 11.18047 before pulling back to close at 11.08662. The recent price trajectory shows an upward trend from lower levels around 10.85076 followed by a mild corrective candle, reflecting a pause in momentum near upper resistance levels.

Key Technical Indicators:

Bollinger Bands: The daily Bollinger Bands show a middle line at 11.05368, an upper band at 11.16445, and a lower band at 0.94291 (10.94291). With the current close at 11.08662, EURSEK trades in the upper half of the band structure, holding above the 20-period simple moving average.

RSI: The 14-day Relative Strength Index (RSI) stands at 54.15, positioning EURSEK in neutral territory. The indicator suggests balanced buying and selling pressures without reaching overbought conditions.

MACD: The D1 MACD indicator is calculated at 0.02984, holding above the zero line. This indicates that broader bullish momentum remains intact, although recent price retracement suggests potential for short-term consolidation.

Support and Resistance:

Key technical levels for EUR/SEK on the daily timeframe include a resistance ceiling at 11.18047 and primary support located at 10.85076. Dynamic support is also provided by the middle Bollinger Band near 11.05368.

News to Watch for EURSEK This Week:

  • Monetary Policy Statement: This release provides crucial details regarding central bank policy directions and macro projections affecting the euro.
  • Main Refinancing Rate: The interest rate announcement directly influences European borrowing conditions and currency positioning.
  • ECB Press Conference: Live commentary from central bank officials may generate increased market volatility and clarify interest rate expectations.

Weekly Outlook and Consideration:

EUR/SEK trades around 11.08662 following a rejection near resistance at 11.18047. Technical indicators on the D1 chart reflect a neutral to mildly positive outlook, supported by an RSI of 54.15 and a MACD value of 0.02984. Price remains above the middle Bollinger Band at 11.05368, keeping the current bias slightly tilted upward. A sustained move above current levels could see another test of resistance at 11.18047, while failure to hold above 11.05368 may lead price toward key support at 10.85076 during upcoming central bank risk events.

Disclaimer: The analysis provided for EUR/SEK is for informational purposes only and does not constitute investment advice. Traders are encouraged to perform their own analysis and research before making any trading decisions. Market conditions can change quickly, so staying informed with the latest data is essential.
EUR/SEK D1 technical analysis chart
EUR/SEK D1 Technical Analysis for 09.05.2026

EUR/SEK Forecast — 29 August 2026

Time Zone: GMT +3

Time Frame: Daily (D1) / Weekly Outlook

Weekly Fundamental Overview:

EUR/SEK dynamics continue to be influenced by Eurozone economic indicators and broader market risk sentiment. Shifts in European inflation metrics can alter market expectations regarding European Central Bank policy, directly affecting euro valuation against the Swedish krona. Traders should monitor upcoming Eurozone economic releases to gauge macroeconomic momentum.

Price Action:

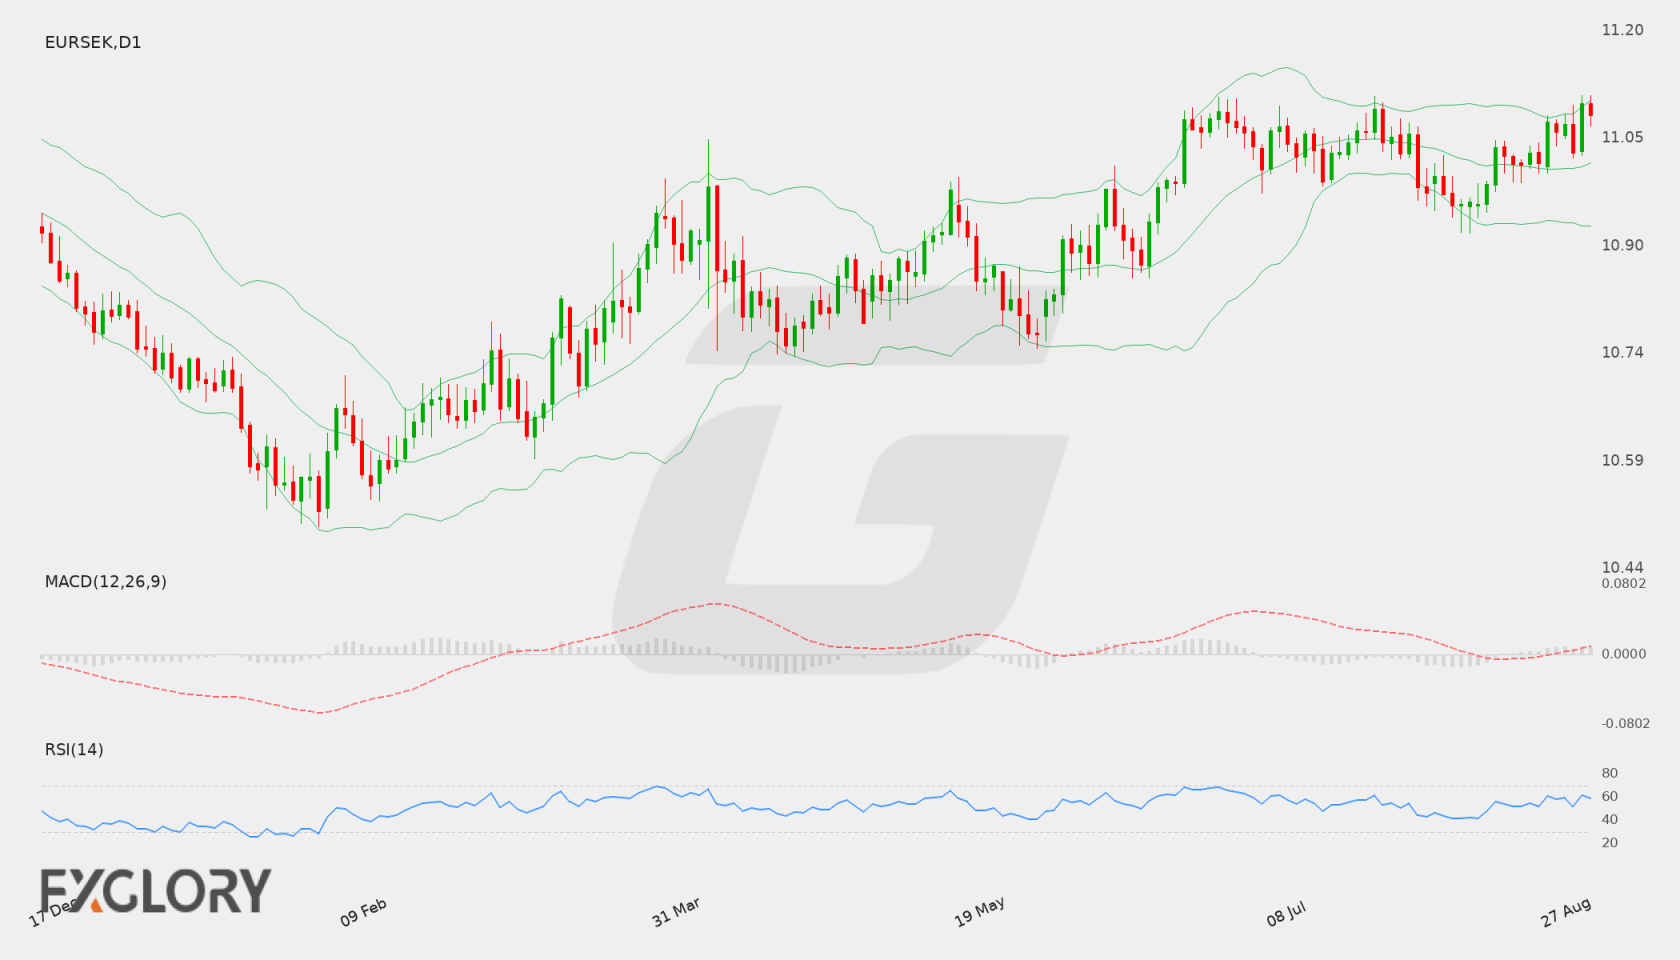
The daily chart for EUR/SEK shows recent bullish momentum, with price advancing toward the upper end of its recent trading range. The pair recorded a last close at 11.08435 after testing higher levels. Consistent higher closes over recent sessions suggest underlying buying interest, though resistance near recent highs presents a key test for further upside progression.

Key Technical Indicators:

Bollinger Bands: The Bollinger Bands on the daily timeframe indicate expanding price movement as EUR/SEK trades near the upper band at 11.10489. With the middle line positioned at 11.01504 and the lower band at 10.92519, the last close at 11.08435 reflects strong upward positioning relative to the 20-day moving average.

RSI: The 14-day Relative Strength Index (RSI) stands at 58.34. This reading demonstrates a solid bullish bias while remaining below overbought territory, leaving room for potential price continuation in either direction based on upcoming drivers.

MACD: The MACD indicator displays a positive value of 0.01750, signaling moderate bullish momentum on the daily timeframe. The histogram and signal lines align with recent price gains, indicating that upward momentum remains active for EUR/SEK.

Support and Resistance:

Immediate resistance for EUR/SEK is established at 11.11150, which serves as a key hurdle for potential upside continuation. On the downside, primary support is located at 10.84843, representing a key level to monitor if corrective pressure emerges.

News to Watch for EURSEK This Week:

  • German Prelim CPI m/m: German inflation data offers critical early signals regarding price pressures in the Eurozone and can influence interest rate expectations.
  • CPI Flash Estimate y/y: Headline Eurozone inflation figures provide broader insight into regional price stability and frequently drive volatility in Euro pairs.
  • Core CPI Flash Estimate y/y: Underlying price trends excluding volatile components offer clear guidance on persistent inflationary pressures across the Eurozone.

Weekly Outlook and Consideration:

The daily outlook for EUR/SEK reflects a positive structure as the price trades near 11.08435 with an RSI of 58.34. If bullish momentum persists and clears resistance at 11.11150, further upward extension may follow. However, failure to sustain these levels could result in a retracement toward the middle Bollinger Band near 11.01504 or support down at 10.84843.

Disclaimer: The analysis provided for EUR/SEK is for informational purposes only and does not constitute investment advice. Traders are encouraged to perform their own analysis and research before making any trading decisions. Market conditions can change quickly, so staying informed with the latest data is essential.

EUR/SEK D1 technical analysis chart
EUR/SEK D1 Technical Analysis for 08.29.2026

EUR/SEK Forecast — 22 August 2026

Time Zone: GMT +3

Time Frame: Daily (D1) / Weekly Outlook

Weekly Fundamental Overview:

The EUR/SEK pair trades with a firmer stance as fundamental dynamics reflect shifting expectations around Eurozone economic activity and interest rate path differentials against the Swedish Krona. Inflation updates across the Euro area remain central to guiding sentiment for the Euro, while broader market risk appetite heavily dictates momentum for sensitive currencies like SEK. Trader focus centers on incoming macroeconomic data to gauge whether European monetary policy will maintain support for the currency pair.

Price Action:

On the daily (D1) chart, EUR/SEK experienced a strong upward move from the recent swing low around 10.95419 up to a close of 11.07323. The pair has produced consecutive bullish daily candles, moving closer to key resistance. A sustained move above current levels would signal continuation of the recent short-term recovery, while failure to overcome upper boundaries could result in consolidation within the recent trading range.

Key Technical Indicators:

Bollinger Bands: The Bollinger Bands on the daily timeframe show EUR/SEK pressing near the upper band at 11.07913. The middle band rests at 11.00599, acting as intermediate dynamic support, while the lower band stands at 10.93285. Price trading near the upper band indicates elevated short-term bullish momentum, though it also alerts traders to potential overextension if dynamic resistance holds.

RSI: The 14-period Relative Strength Index (RSI) registers at 60.49. Holding comfortably above the neutral 50 line, the RSI underscores underlying bullish bias without entering overbought territory (above 70), indicating room for additional movement in either direction depending on catalyst strength.

MACD: The MACD indicator yields a positive value of 0.0056, reflecting positive momentum on the daily chart. The baseline remains above zero with bullish histogram expansion, supporting the recent upward push in EUR/SEK, though monitored for signs of deceleration as price approaches technical resistance.

Support and Resistance:

Key daily technical levels position strong resistance at 11.10984, which caps recent upside attempts. On the downside, critical support is identified at 10.75036, with additional intermediate support located along the daily middle Bollinger Band near 11.00599.

News to Watch for EURSEK This Week:

  • German Prelim CPI m/m: This release measures price changes in Germany and offers early clues on Eurozone inflation dynamics.
  • CPI Flash Estimate y/y: Broad Eurozone inflation figures provide key insight into price pressure trends across the monetary union.
  • Core CPI Flash Estimate y/y: Underlying inflation metrics serve as a critical reference for evaluating potential European Central Bank policy shifts.

Weekly Outlook and Consideration:

The weekly outlook for EUR/SEK points to a moderately bullish environment led by positive daily technical indicators. With price approaching resistance at 11.10984, a confirmed break higher could open the path toward extended upside structure. Conversely, if momentum slows near the upper Bollinger Band, EUR/SEK may pull back to test support around the middle band at 11.00599 or secondary support down at 10.75036. Traders should monitor Eurozone inflation updates alongside broader risk sentiment to confirm directional momentum.

Disclaimer: The analysis provided for EUR/SEK is for informational purposes only and does not constitute investment advice. Traders are encouraged to perform their own analysis and research before making any trading decisions. Market conditions can change quickly, so staying informed with the latest data is essential.

1EUR = –––SEK –––% ▼
EURSEK
Loading chart...