
USDZAR Forecast

USD iconZAR icon
USD/ZAR

US Dollar vs South African Rand

USD/ZAR Live Price

16.40086
+0.56%

USD/ZAR Forecast — 20 September 2026

Time Zone: GMT +3

Time Frame: Daily (D1) / Weekly Outlook

Weekly Fundamental Overview:

The USD/ZAR currency pair remains sensitive to economic data trends and global risk sentiment. High-impact US releases, including GDP updates, inflation gauges, and comprehensive labor market data, serve as major catalysts for US Dollar valuations. Market participants continue to gauge underlying economic resilience and interest rate expectations, which directly influence flows into emerging market currencies like the South African Rand.

Price Action:

On the daily (D1) chart, USD/ZAR (USDZAR) recently closed at 16.25807, consolidating after a brief rise toward the 16.3746 level. The pair continues to trade within a broader structure defined by a key support zone at 15.89213 and an upper resistance level at 16.97254. Recent daily candles display a mix of modest upward pushes and pullbacks, reflecting balanced trading conditions.

Key Technical Indicators:

Bollinger Bands: The Bollinger Bands indicator shows a middle band (20-day moving average) at 16.08876, an upper band at 16.33481, and a lower band at 15.84272. With the last close at 16.25807, USD/ZAR is trading above the middle line and near the upper boundary, indicating that recent price action has leaned toward the upper half of the band envelope.

RSI: The 14-period Relative Strength Index (RSI) stands at 54.49. Positioned slightly above the neutral 50 level, the RSI reflects a balanced market with a slight bias toward buyers, remaining well clear of overbought or oversold territories.

MACD: The Moving Average Convergence Divergence (MACD) indicator records a reading of 0.00858. Operating above the zero mark, the positive MACD value suggests mild bullish momentum, although the histogram signal remains moderate.

Support and Resistance:

Key technical levels for USD/ZAR include immediate support around 15.89213, reinforced by the lower Bollinger Band area. On the upside, major resistance is established at 16.97254, which bounds potential bullish rallies.

News to Watch for USDZAR This Week:

  • CB Consumer Confidence: Shifts in consumer sentiment can impact economic outlooks and influence dollar demand.
  • JOLTS Job Openings: High job openings reflect labor market strength, which can alter rate expectations.
  • ADP Non-Farm Employment Change: Private sector employment gains offer insights into overall labor market performance.
  • Core PCE Price Index m/m: Key inflation metrics guide central bank decisions on monetary policy adjustments.
  • Final GDP q/q: Growth data provides confirmation on overall economic expansion and currency strength.
  • ISM Manufacturing PMI: Manufacturing sector health reflects broad economic activity and business sentiment.
  • Average Hourly Earnings m/m: Wage growth trends feed into underlying inflationary pressures and policy outlooks.
  • Non-Farm Employment Change: Broader employment data significantly influences market volatility and currency trends.
  • Unemployment Rate: Joblessness metrics help gauge labor market slack and economic stability.

Weekly Outlook and Consideration:

The weekly outlook for USD/ZAR (USDZAR) presents a neutral-to-slightly bullish technical setup on the daily timeframe. Price trades at 16.25807 above the 16.08876 middle Bollinger Band, supported by a modest positive MACD of 0.00858 and an RSI of 54.49. While technicals point to mild constructive momentum within the 15.89213 support and 16.97254 resistance corridor, market momentum will largely depend on incoming economic releases and risk sentiment.

Disclaimer: The analysis provided for USD/ZAR is for informational purposes only and does not constitute investment advice. Traders are encouraged to perform their own analysis and research before making any trading decisions. Market conditions can change quickly, so staying informed with the latest data is essential.
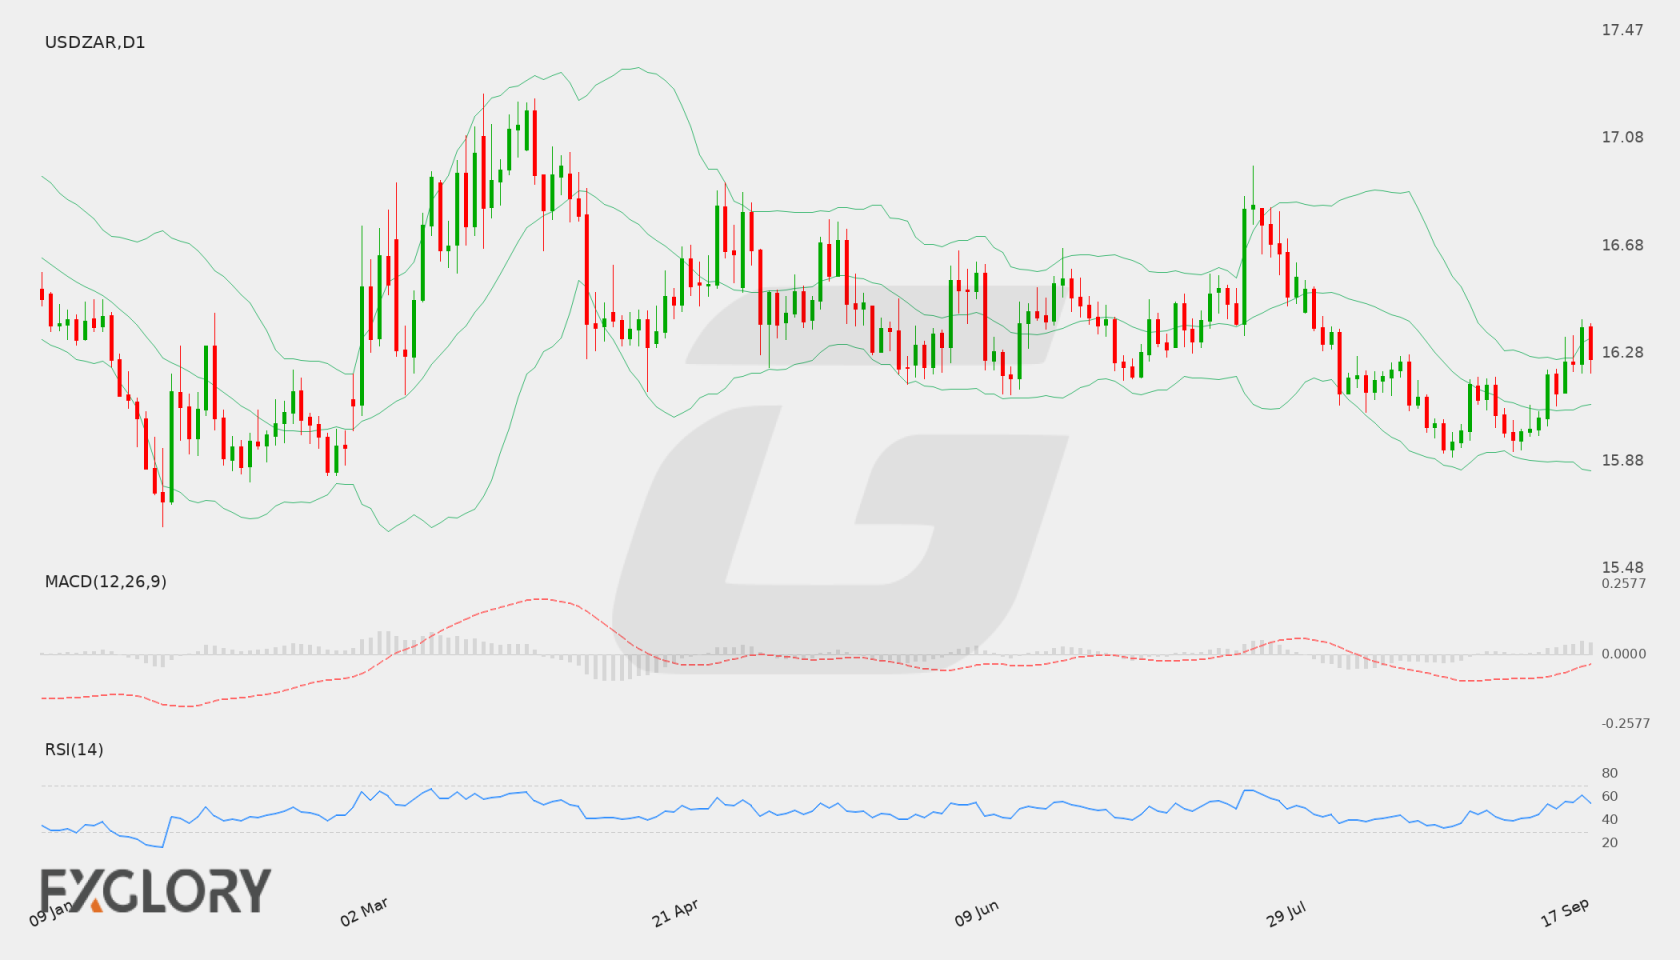
USD/ZAR D1 technical analysis chart
USD/ZAR D1 Technical Analysis for 09.20.2026

USD/ZAR Forecast — 5 September 2026

Time Zone: GMT +3

Time Frame: Daily (D1) / Weekly Outlook

Weekly Fundamental Overview:

USD/ZAR remains sensitive to scheduled market events and broader risk sentiment. Traders should watch high-impact calendar releases and USD movement where relevant before forming a directional view.

Price Action:

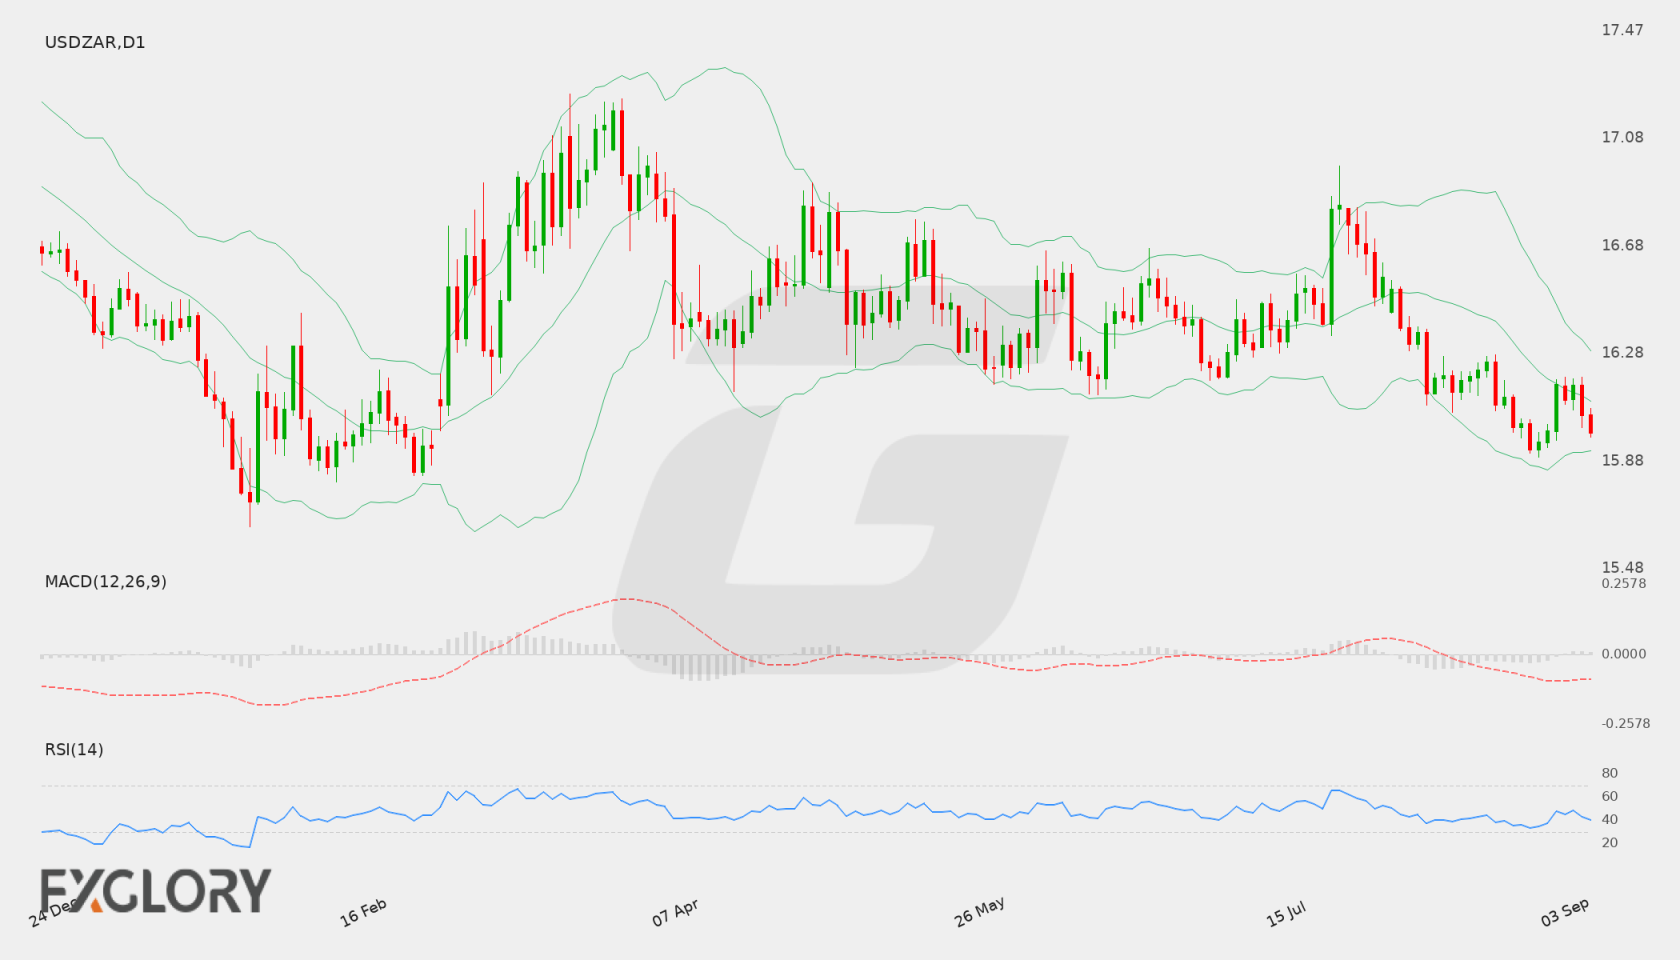
USDZAR is trading near 15.98489, with current daily movement framed by nearby support and resistance.

Key Technical Indicators:

Bollinger Bands: Price is being assessed against the 20-period Bollinger Bands, with middle band near 16.101828, upper band near 16.288598905721, and lower band near 15.915057094279.

RSI: RSI(14) is near 40.343629860654, suggesting traders should watch whether momentum holds, reaches overbought pressure, or weakens toward oversold territory.

MACD: MACD is near -0.085689995376899, so momentum should be watched for continuation or loss of strength on the daily chart.

Support and Resistance:

Key support is near 15.89213, while key resistance is near 16.97254.

News to Watch for USDZAR This Week:

  • Watch scheduled high-impact releases, central bank comments, and broader risk sentiment this week; no specific calendar events are available in current plugin data.

Weekly Outlook and Consideration:

USD/ZAR may remain guided by daily price action, support and resistance reactions, momentum indicators, and supplied calendar events. Traders should wait for confirmation around key levels and avoid assuming that current conditions guarantee the next move.

Disclaimer: The analysis provided for USD/ZAR is for informational purposes only and does not constitute investment advice. Traders are encouraged to perform their own analysis and research before making any trading decisions. Market conditions can change quickly, so staying informed with the latest data is essential.
USD/ZAR D1 technical analysis chart
USD/ZAR D1 Technical Analysis for 09.05.2026

USD/ZAR Forecast — 29 August 2026

Time Zone: GMT +3

Time Frame: Daily (D1) / Weekly Outlook

Weekly Fundamental Overview:

The USD/ZAR currency pair remains largely influenced by broad US dollar sentiment and overall risk appetite across emerging markets. Upcoming economic announcements from the United States, particularly regarding employment and manufacturing sectors, are poised to impact trader expectations and drive short-term price movements in USD/ZAR.

Price Action:

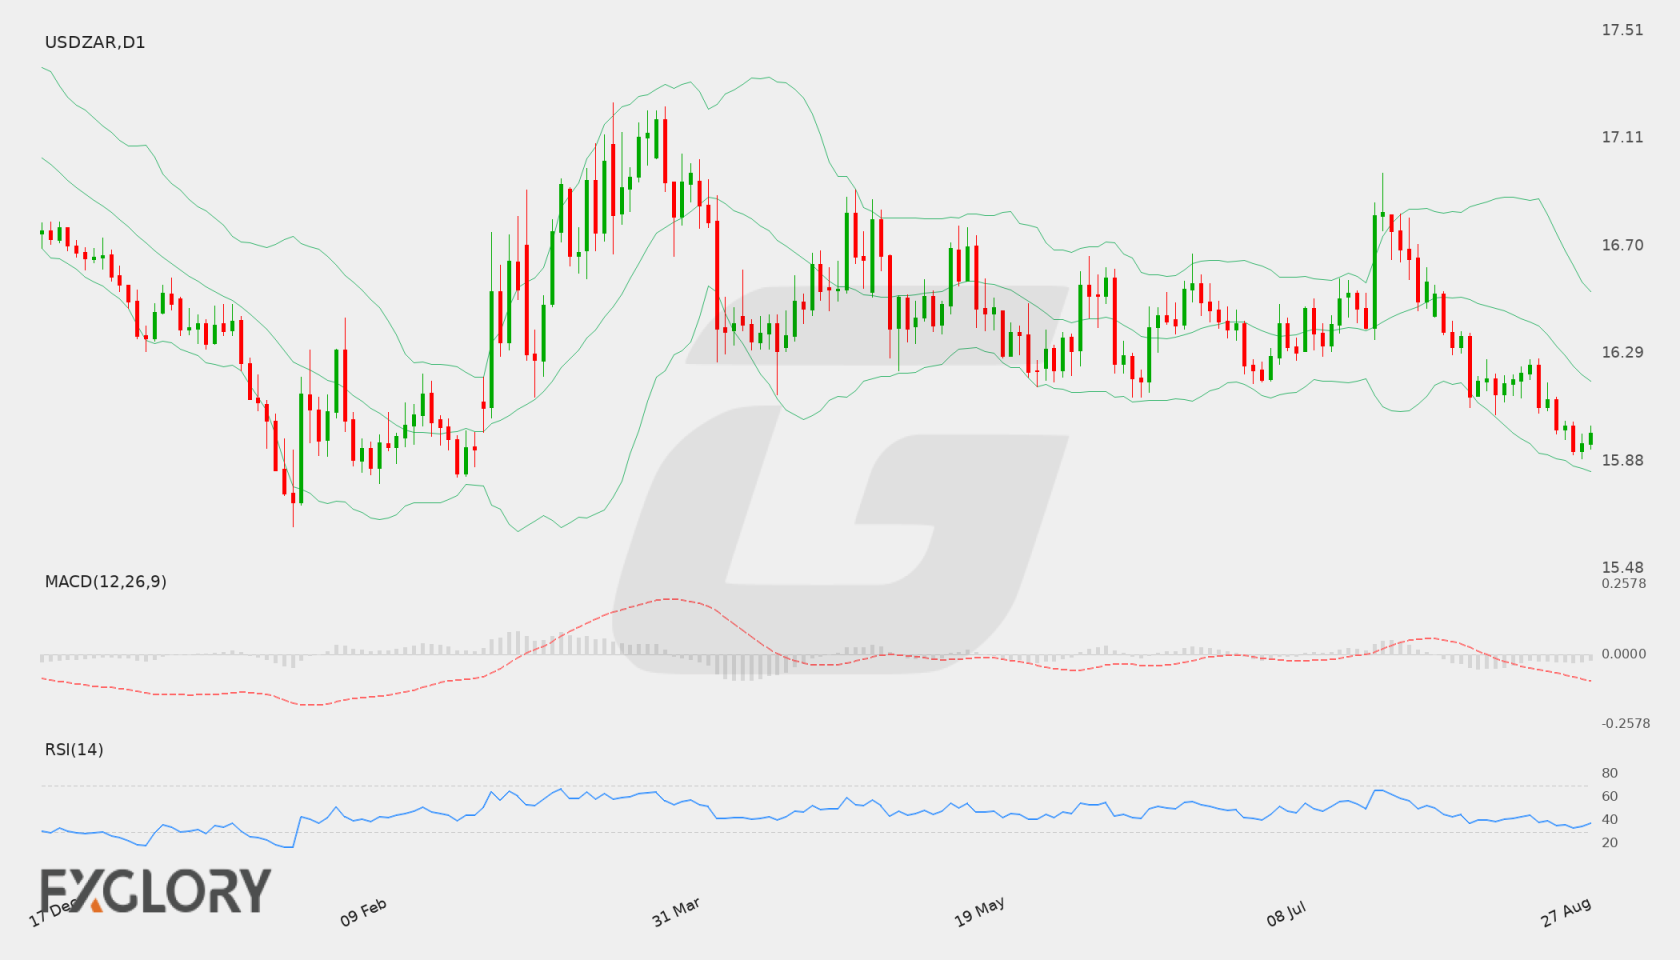
On the Daily (D1) chart, USD/ZAR has experienced sustained selling pressure, with the price trending downward to close at 15.98954. Recent daily candles demonstrate a pattern of lower highs and lower lows, pressing the price near recent local support levels.

Key Technical Indicators:

Bollinger Bands: The Bollinger Bands display a downward tilt as USD/ZAR trades near the lower band at 15.84433. The middle band (20-period moving average) sits at 16.18481, acting as dynamic overhead resistance, while the upper band is located at 16.52530.

RSI: The 14-day Relative Strength Index (RSI) stands at 37.41. This reading indicates bearish momentum without entering oversold territory below 30, suggesting sellers currently retain market control.

MACD: The MACD indicator reinforces the prevailing bearish momentum, registering a value of -0.12090. Positioned below the zero line, the technical oscillator shows that downside momentum continues to guide the pair on the daily timeframe.

Support and Resistance:

Key technical levels for USD/ZAR include a primary support level at 15.89213, backed by the lower Bollinger Band at 15.84433. To the upside, main resistance is established at 16.97254, with intermediate resistance near the middle Bollinger Band at 16.18481.

News to Watch for USDZAR This Week:

  • ISM Manufacturing PMI: Measures manufacturing economic activity which can influence broader US dollar valuation.
  • JOLTS Job Openings: Indicates total job openings and labor demand trends across the economy.
  • ISM Manufacturing Prices: Tracks price inflation experienced by manufacturers during production processes.
  • ADP Non-Farm Employment Change: Provides an early indicator of private sector employment performance.
  • ISM Services PMI: Evaluates growth conditions within the services sector to gauge economic momentum.
  • Non-Farm Employment Change: Measures overall monthly job creation and reflects labor market health.
  • Unemployment Rate: Details the percentage of unemployed individuals actively seeking work.
  • Average Hourly Earnings m/m: Assesses wage growth trends which directly influence consumer inflation.

Weekly Outlook and Consideration:

The D1 outlook for USD/ZAR reflects a firm bearish trend supported by an RSI of 37.41 and a negative MACD value of -0.12090. If the current downward pressure persists, the pair may test key support at 15.89213. Conversely, if buyers regain footing, a corrective move toward the middle Bollinger Band around 16.18481 could materialize, with broader resistance capped near 16.97254. Market participants will watch incoming economic releases for directional clarity.

Disclaimer: The analysis provided for USD/ZAR is for informational purposes only and does not constitute investment advice. Traders are encouraged to perform their own analysis and research before making any trading decisions. Market conditions can change quickly, so staying informed with the latest data is essential.
USD/ZAR D1 technical analysis chart
USD/ZAR D1 Technical Analysis for 08.29.2026

USD/ZAR Forecast — 23 August 2026

Time Zone: GMT +3

Time Frame: Daily (D1) / Weekly Outlook

Weekly Fundamental Overview:

The USD/ZAR currency pair enters the week driven by major U.S. economic data releases, including consumer sentiment, core PCE inflation, preliminary GDP data, and benchmark payroll revisions. These releases are critical for determining the strength of the U.S. Dollar and assessing the likely path for Federal Reserve policy. Meanwhile, broader market risk sentiment continues to impact emerging market currencies like the South African Rand, making upcoming U.S. macroeconomic indicators key drivers for USDZAR price momentum.

Price Action:

On the daily (D1) chart, USD/ZAR closed at 16.11625, remaining under pressure after pulling back from higher levels observed earlier in the period. The recent price action reflects a downward bias, with daily candles consolidating near recent lows around 16.08966 and 16.11625, testing lower support zones.

Key Technical Indicators:

Bollinger Bands: The 20-period daily Bollinger Bands show a middle band at 16.36088, an upper band at 16.81579, and a lower band at 15.90597. With the last close at 16.11625, USD/ZAR trades in the lower half of the band structure, reflecting prevailing bearish momentum while remaining above lower boundary support.

RSI: The 14-day Relative Strength Index (RSI) is currently at 39.55. Positioned below the 50 neutral mark, the RSI confirms subdued buying interest and a bearish bias, though it remains above the oversold threshold of 30.

MACD: The MACD indicator on the daily chart stands at -0.08674, remaining in negative territory. This negative value indicates that short-term momentum favors the downside for USD/ZAR.

Support and Resistance:

Key technical levels for USD/ZAR include immediate support at 16.05893 and major resistance at 16.97254. Additional dynamic resistance is presented by the middle Bollinger Band at 16.36088.

News to Watch for USDZAR This Week:

  • CB Consumer Confidence: This release provides insight into household sentiment and consumer spending expectations.
  • Core PCE Price Index m/m: As a key inflation gauge for the Federal Reserve, this figure can influence U.S. monetary policy expectations.
  • Prelim GDP q/q: This reading offers an updated view of U.S. economic growth and potential Dollar volatility.
  • Prelim GDP Price Index q/q: This metric measures broader price changes within gross domestic product and impacts interest rate outlooks.
  • Unemployment Claims: Weekly labor market data offers timely clues about the health of the U.S. employment picture.
  • Prelim Benchmark Payrolls Revision: Historical revisions to employment data can significantly alter market perceptions of U.S. labor strength.

Weekly Outlook and Consideration:

The weekly outlook for USD/ZAR (USDZAR) remains tilted toward the downside as long as price action trades below the middle Bollinger Band at 16.36088. With the MACD at -0.08674 and the RSI at 39.55, technical indicators point to persistent bearish pressure. A breakdown below key support at 16.05893 could open the door toward the lower Bollinger Band at 15.90597. Conversely, any rebound would need to overcome resistance at 16.36088 and ultimately 16.97254 to shift the daily trend back to neutral or bullish. Traders should carefully monitor incoming U.S. economic reports for potential volatility triggers.

Disclaimer: The analysis provided for USD/ZAR is for informational purposes only and does not constitute investment advice. Traders are encouraged to perform their own analysis and research before making any trading decisions. Market conditions can change quickly, so staying informed with the latest data is essential.

USD/ZAR Forecast — 15 August 2026

Time Zone: GMT +3

Time Frame: Daily (D1) / Weekly Outlook

Weekly Fundamental Overview:

The USD/ZAR pair is influenced by broader risk sentiment surrounding emerging market currencies as well as high-impact macroeconomic data out of the United States. Traders are focusing on potential shifts in US policy expectations driven by upcoming labor and manufacturing reports, which could drive price fluctuations in the foreign exchange market.

Price Action:

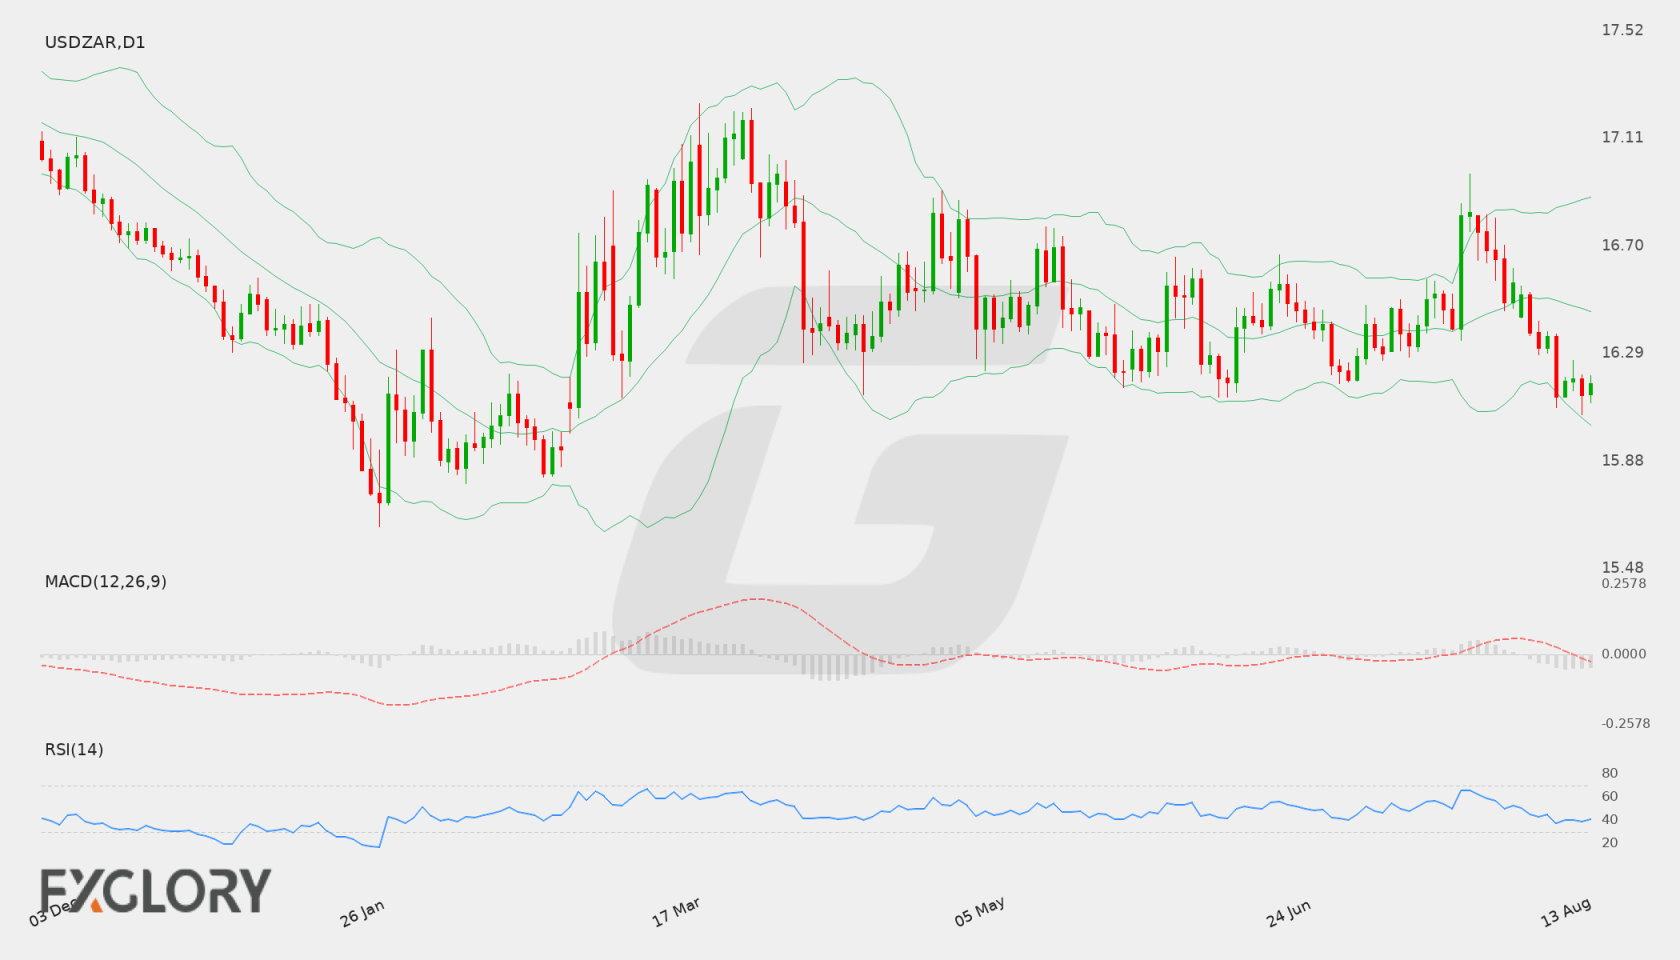
On the daily (D1) chart, USD/ZAR recently closed at 16.17828 following a persistent drift from higher levels. Recent daily candles display a slight downward bias, positioning price action closer to recent lows while remaining below the mid-point of its multi-week range.

Key Technical Indicators:

Bollinger Bands: The Bollinger Bands indicator shows a middle band at 16.45179, an upper band at 16.88400, and a lower band at 16.01957. With the last close at 16.17828, price is currently trading between the middle and lower bands, reflecting ongoing downside pressure.

RSI: The 14-period Relative Strength Index (RSI) stands at 40.55, which places momentum in neutral-to-bearish territory while remaining above oversold conditions.

MACD: The MACD indicator registers a reading of -0.07444, maintaining a value below the zero mark. This indicates that bearish momentum remains present on the daily timeframe.

Support and Resistance:

Key technical support for USD/ZAR is identified at 16.05893, while primary technical resistance is located at 16.97254.

News to Watch for USDZAR This Week:

  • Prelim Benchmark Payrolls Revision: Adjustments to historical employment data can alter perceptions of labor market strength.
  • FOMC Meeting Minutes: Detailed discussions from the Federal Reserve may offer cues on future monetary policy direction.
  • Unemployment Claims: Weekly jobless figures provide updated insight into current conditions within the US labor force.
  • Philly Fed Manufacturing Index: Regional business outlook readings reflect health and activity in the manufacturing sector.
  • Flash Manufacturing PMI: Preliminary purchasing managers survey data gauges overall momentum across manufacturing.

Weekly Outlook and Consideration:

The weekly outlook for USD/ZAR remains cautious as technical indicators lean toward negative momentum on the daily chart. Price action near 16.17828 keeps the pair situated above key support at 16.05893, while resistance at 16.97254 limits upside moves. Traders should monitor upcoming economic updates alongside broader risk sentiment to assess whether the pair consolidates or tests key technical boundaries.

Disclaimer: The analysis provided for USD/ZAR is for informational purposes only and does not constitute investment advice. Traders are encouraged to perform their own analysis and research before making any trading decisions. Market conditions can change quickly, so staying informed with the latest data is essential.

USD/ZAR D1 technical analysis chart
USD/ZAR D1 Technical Analysis for 08.15.2026
1USD = –––ZAR –––% ▼
USDZAR
Loading chart...