Time Zone: GMT +3
Time Frame: Daily (D1) / Weekly Outlook
Weekly Fundamental Overview:
USD/MXN (USDMXN) dynamics remain influenced by economic data expectations and monetary policy outlooks. Market participants evaluate risk sentiment and yield differentials, which play a central role in driving movements for emerging market currency pairs like the Mexican Peso against the U.S. Dollar.
Price Action:
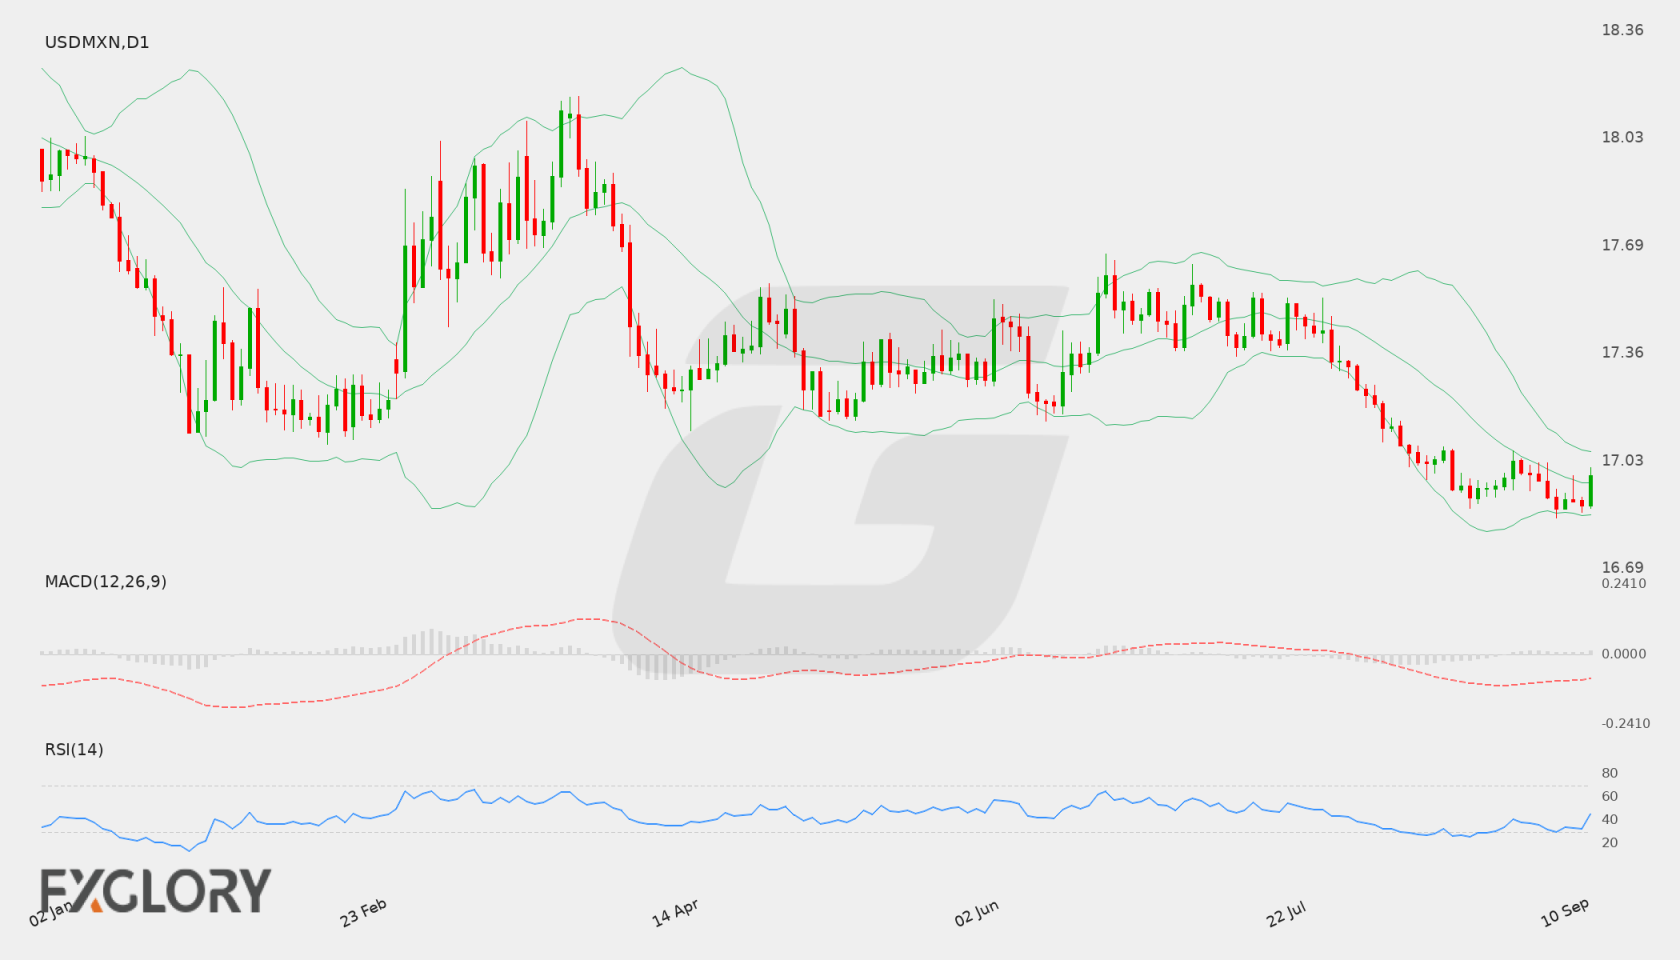
On the Daily (D1) chart, USD/MXN closed at 16.98227 after rebounding from a daily low near 16.85067. Price action shows a slight recovery back toward the middle of its recent trading range, exiting recent lower extremes.
Key Technical Indicators:
Bollinger Bands: The Bollinger Bands for USD/MXN show a middle line at 16.95878, an upper band at 17.05711, and a lower band at 16.86045. The current price of 16.98227 resides slightly above the middle band, reflecting temporary stabilization within the band range.
RSI: The 14-period RSI is recorded at 45.19, staying in neutral territory below the 50 line and indicating an absence of strong directional momentum or oversold conditions.
MACD: The MACD indicator is currently reading -0.07267, remaining in negative territory to highlight persistent underlying bearish pressure from previous downward swings.
Support and Resistance:
Key technical levels for USD/MXN feature established support at 16.85067 and resistance at 17.66976.
News to Watch for USDMXN This Week:
- Core Retail Sales m/m: Shifts in consumer demand can influence economic expectations and currency strength.
- Retail Sales m/m: Retail performance figures provide insights into economic health and consumer behavior.
- FOMC Economic Projections: Central bank outlooks offer clarity on future monetary policy direction.
- FOMC Statement: Official monetary policy announcements guide market sentiment and rate expectations.
- Federal Funds Rate: Interest rate decisions heavily affect currency yield appeal and valuation.
- FOMC Press Conference: Executive comments may generate volatility across exchange rate pairs.
- Unemployment Claims: Weekly employment data serves as a measure of labor market conditions.
Weekly Outlook and Consideration:
USD/MXN enters the new week trading at 16.98227, framed between technical support at 16.85067 and resistance at 17.66976. Technical indicators highlight neutral momentum, with RSI at 45.19, MACD at -0.07267, and price holding near the Bollinger middle band of 16.95878. Price action will depend on whether buyers can push toward upper resistance or if sellers force a return toward support.
Disclaimer: The analysis provided for USD/MXN is for informational purposes only and does not constitute investment advice. Traders are encouraged to perform their own analysis and research before making any trading decisions. Market conditions can change quickly, so staying informed with the latest data is essential.