
GBPJPY Forecast

GBP iconJPY icon
GBP/JPY

British Pound vs Japanese Yen

GBP/JPY Live Price

208.53800
+0.14%

GBP/JPY Forecast — 27 September 2026

Time Zone: GMT +3

Time Frame: Daily (D1) / Weekly Outlook

Weekly Fundamental Overview:

The fundamental backdrop for GBP/JPY continues to be influenced by monetary policy differentials between the Bank of England and the Bank of Japan, alongside broader geopolitical and global economic conditions. Sentiment surrounding interest rate trajectories and general market risk appetite remain primary drivers for GBPJPY.

Price Action:

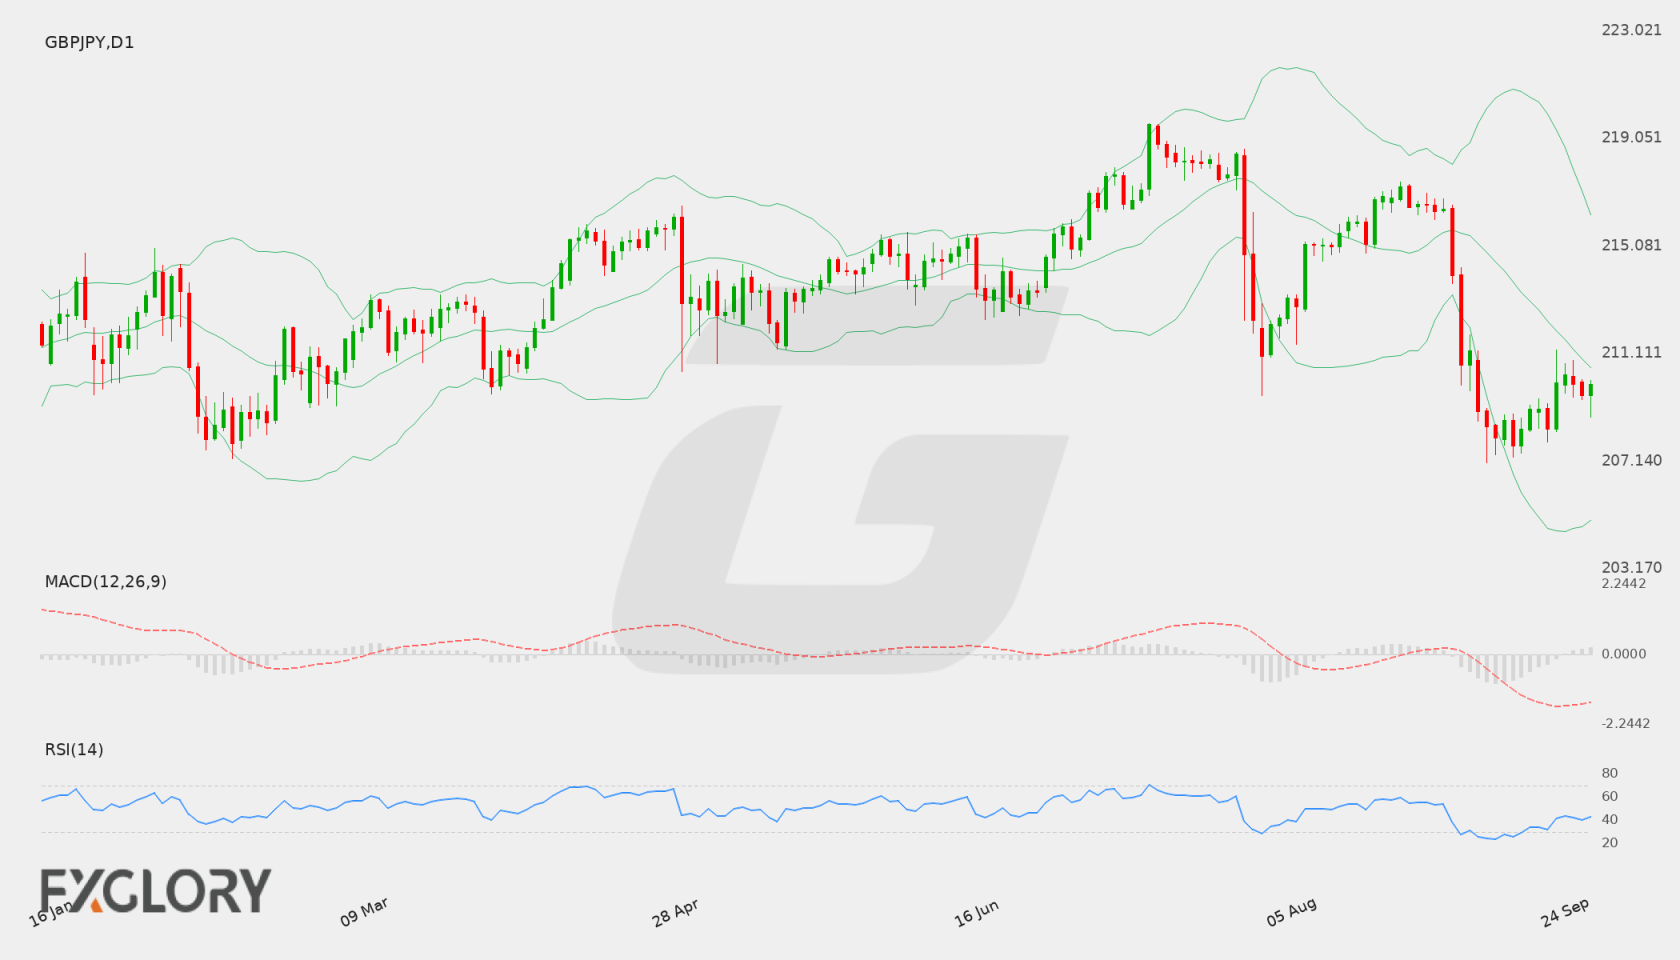
On the daily (D1) timeframe, GBP/JPY closed at 209.97 after fluctuating within a modest range over recent sessions. The pair remains stabilized above the critical support level at 207.07 while working through a period of technical consolidation below resistance at 219.582.

Key Technical Indicators:

Bollinger Bands: The daily Bollinger Bands present a middle line at 210.59, an upper band at 216.23, and a lower band at 204.95. With GBP/JPY trading at 209.97, price sits slightly under the middle boundary, indicating mild underlying weakness in the short-term structure.

RSI: The 14-period Relative Strength Index (RSI) is registered at 42.56. Residing under the neutral 50 threshold, the indicator points to weak buying interest without entering oversold territory.

MACD: The D1 MACD indicator records a reading of -1.32, remaining beneath the zero mark. This positioning highlights negative momentum, reflecting recent downward pressure on GBPJPY.

Support and Resistance:

Key technical levels for GBP/JPY include key daily support situated at 207.07 and major resistance established at 219.582.

News to Watch for GBPJPY This Week:

  • No specific events are available in the calendar for this period. Traders should focus on generic high-impact releases, central bank comments, and broader risk sentiment.

Weekly Outlook and Consideration:

GBP/JPY starts the week at 209.97, retaining a cautious tone across daily indicators. The combination of an RSI at 42.56, MACD at -1.32, and price positioning below the middle Bollinger Band of 210.59 points toward ongoing short-term consolidation with a slight bearish tilt. A sustained hold above technical support at 207.07 maintains the current range, while any recovery toward resistance at 219.582 would require a push back above the middle Bollinger threshold.

Disclaimer: The analysis provided for GBP/JPY is for informational purposes only and does not constitute investment advice. Traders are encouraged to perform their own analysis and research before making any trading decisions. Market conditions can change quickly, so staying informed with the latest data is essential.
GBP/JPY D1 technical analysis chart
GBP/JPY D1 Technical Analysis for 09.27.2026

GBP/JPY Forecast — 20 September 2026

Time Zone: GMT +3

Time Frame: Daily (D1) / Weekly Outlook

Weekly Fundamental Overview:

Fundamental drivers for GBP/JPY remain closely tied to shifting monetary policy expectations between the Bank of England and the Bank of Japan, alongside broader global market risk sentiment. Shifts in Japanese inflation metrics and market demand for carry trades continue to influence sentiment around the currency pair.

Price Action:

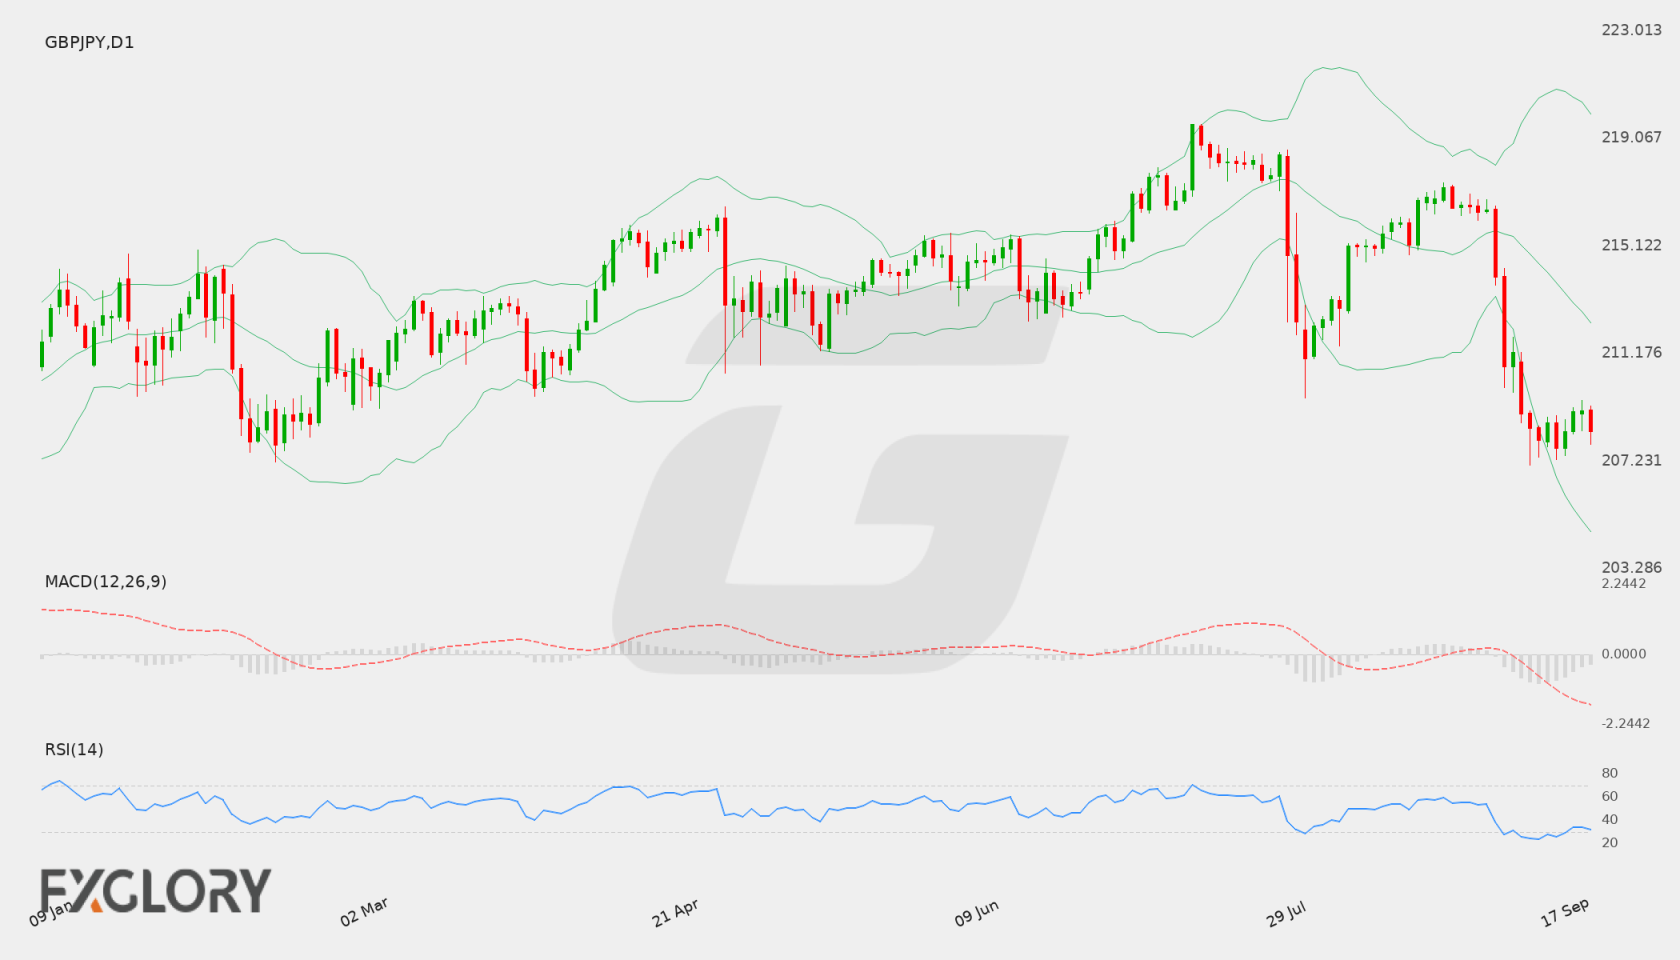
On the daily timeframe, GBP/JPY has experienced a distinct downward trajectory from high levels near 219.582, moving down to close at 208.338. Price action shows persistent selling pressure over recent sessions, with price currently stabilizing slightly above the key support zone around 207.07.

Key Technical Indicators:

Bollinger Bands: The Bollinger Bands display a middle baseline at 212.301, with the upper band at 219.956 and the lower band at 204.646. With GBP/JPY trading at 208.338, price remains in the lower band region, reflecting prevailing downside control.

RSI: The 14-period RSI sits at 31.55, holding near the oversold threshold of 30. While this confirms strong downward pressure in recent trading sessions, it also indicates the potential for consolidation or a technical bounce if selling momentum wanes.

MACD: The MACD indicator prints a negative value of -1.965, trading below its signal line. This configuration highlights continued bearish momentum on the daily chart for GBP/JPY.

Support and Resistance:

Key technical levels for GBP/JPY establish primary support at 207.07 and major resistance at 219.582.

News to Watch for GBPJPY This Week:

  • Tokyo Core CPI y/y: This inflation benchmark provides essential economic insight that could influence sentiment surrounding Bank of Japan policy and impact JPY cross dynamics.

Weekly Outlook and Consideration:

GBP/JPY enters the new trading week with a bearish bias after settling at 208.338. Technical indicators align with recent weakness, as MACD remains at -1.965 and price sits below the middle Bollinger band of 212.301. However, with RSI at 31.55 approaching oversold levels, price action near the primary support level of 207.07 will be critical. A firm hold above support could encourage a period of stabilization, whereas failure to sustain this floor may lead to test of lower band boundaries. Resistance remains well above at 219.582.

Disclaimer: The analysis provided for GBP/JPY is for informational purposes only and does not constitute investment advice. Traders are encouraged to perform their own analysis and research before making any trading decisions. Market conditions can change quickly, so staying informed with the latest data is essential.
GBP/JPY D1 technical analysis chart
GBP/JPY D1 Technical Analysis for 09.20.2026

GBP/JPY Forecast — 12 September 2026

Time Zone: GMT +3

Time Frame: Daily (D1) / Weekly Outlook

Weekly Fundamental Overview:

GBP/JPY trades under notable influence from divergent central bank prospects and shifts in risk sentiment. Market participants closely monitor incoming monetary policy updates from both the Bank of England and the Bank of Japan, alongside economic indicators concerning UK inflation, employment, and retail spending.

Price Action:

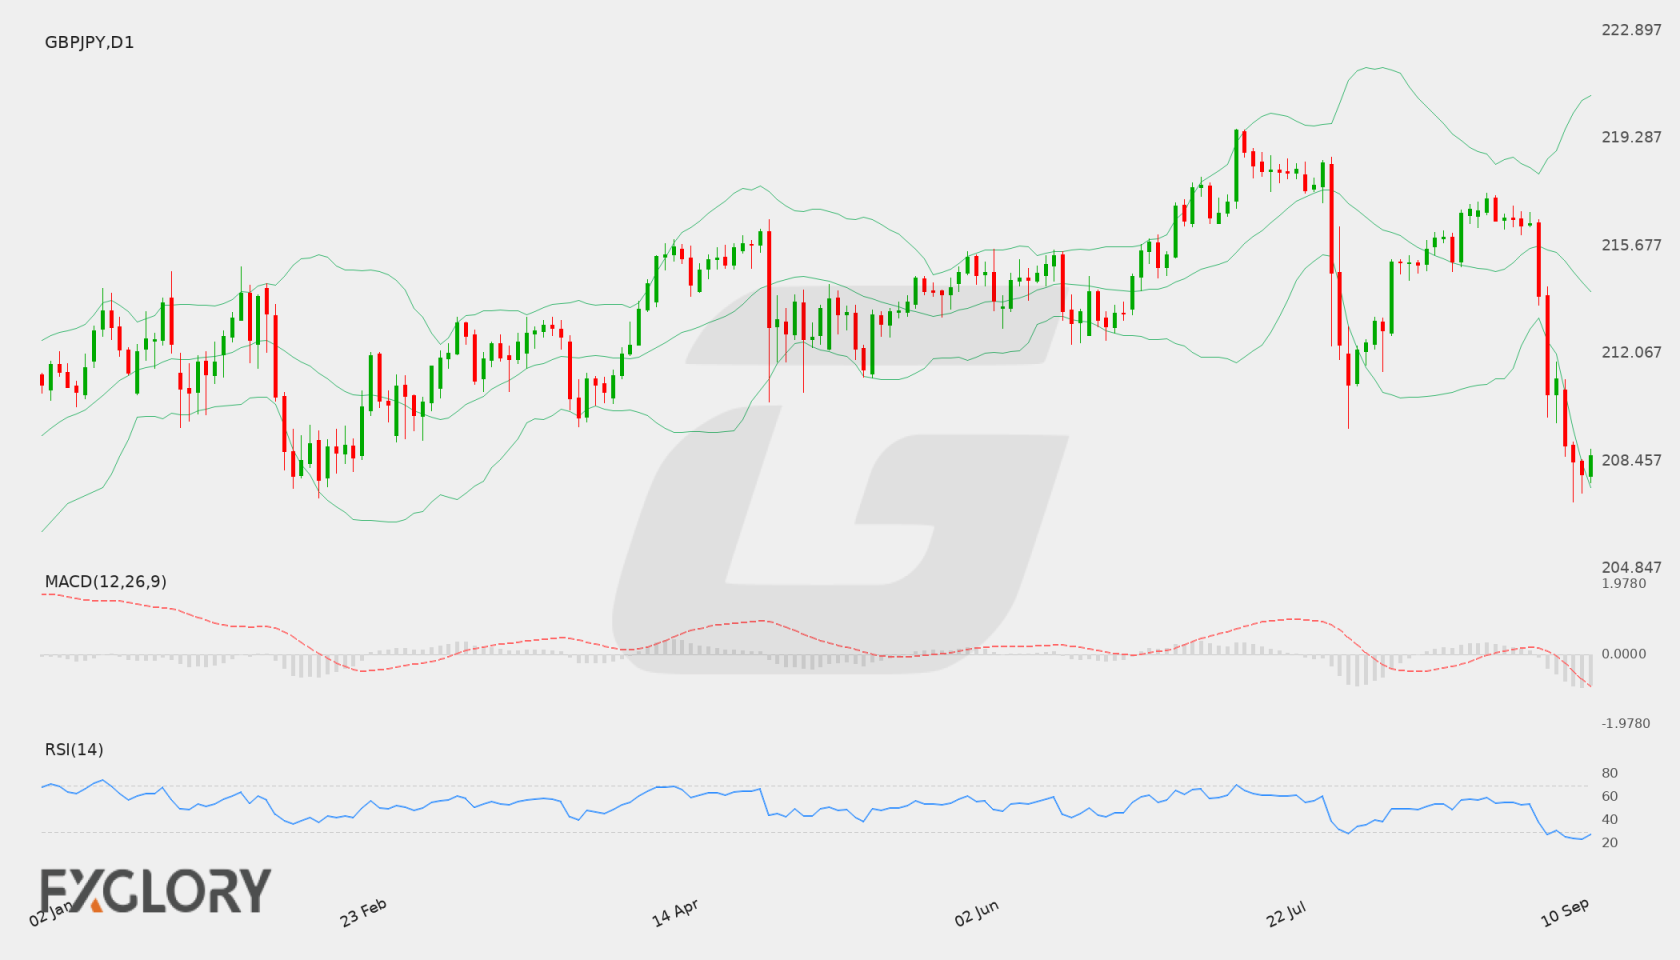
On the daily chart, GBP/JPY has experienced a sharp decline over recent sessions, dropping from levels above 216.00 down toward a low of 207.37 before settling at 208.63. The market displays short-term selling pressure, though recent candles indicate potential stabilization near key historic support levels.

Key Technical Indicators:

Bollinger Bands: The Bollinger Bands highlight expanded volatility on the daily timeframe, with the upper band at 220.73, middle line at 214.15, and lower band at 207.56. With the last close at 208.63 trading close to the lower band, price remains constrained near the bottom envelope of the channel.

RSI: The 14-period Relative Strength Index (RSI) registers at 27.52, positioning the indicator within oversold territory below the 30 threshold. This suggests that recent selling momentum has been strong and could invite technical pullbacks or consolidation.

MACD: The MACD indicator records a reading of -1.798, remaining in negative territory. This negative value reflects downward momentum on the daily timeframe following recent bearish price swings.

Support and Resistance:

Immediate technical support for GBP/JPY rests at 207.07, located near the lower Bollinger Band boundary. On the upside, major resistance stands at 219.582, marking a primary hurdle for any broader recovery attempts.

News to Watch for GBPJPY This Week:

  • Claimant Count Change: Evaluates changes in UK unemployment claims, influencing British pound sentiment.
  • Average Earnings Index 3m/y: Measures wage growth trends in the UK, impacting inflationary pressures.
  • CPI y/y: Tracks annual UK consumer inflation, providing critical guidance for monetary policy decisions.
  • Official Bank Rate: Signals the primary interest rate set by the Bank of England, driving rate expectations.
  • MPC Official Bank Rate Votes: Reveals internal voting splits among policy makers, shedding light on future rate shifts.
  • Monetary Policy Summary: Outlines economic assessments and rate decisions from the UK central bank.
  • Monetary Policy Statement: Delivers detailed insights into policy decisions and economic perspectives in Japan.
  • BOJ Press Conference: Provides verbal commentary on monetary policy, economic outlook, and exchange rate dynamics.
  • BOJ Policy Rate: Sets key Japanese interest rate targets, directly impacting yen valuation.
  • Retail Sales m/m: Reflects monthly changes in UK consumer spending performance.

Weekly Outlook and Consideration:

GBP/JPY enters the week with bearish pressure as daily indicators point to oversold conditions near key lower levels. While the MACD of -1.798 and price location near the lower Bollinger Band (207.56) reflect recent weakness, the 14-day RSI at 27.52 highlights potential for short-term bounces. A sustained defense of support at 207.07 may spark corrective recoveries toward the middle Bollinger Band at 214.15, whereas a breakdown below support could extend downward trajectory. Traders should monitor upcoming central bank events and economic data releases for potential shifts in direction.

Disclaimer: The analysis provided for GBP/JPY is for informational purposes only and does not constitute investment advice. Traders are encouraged to perform their own analysis and research before making any trading decisions. Market conditions can change quickly, so staying informed with the latest data is essential.
GBP/JPY D1 technical analysis chart
GBP/JPY D1 Technical Analysis for 09.12.2026

GBP/JPY Forecast — 5 September 2026

Time Zone: GMT +3

Time Frame: Daily (D1) / Weekly Outlook

Weekly Fundamental Overview:

Fundamental drivers for GBP/JPY remain influenced by United Kingdom macroeconomic performance and overall risk sentiment affecting the Japanese Yen. Shifting economic expectations and market risk conditions continue to guide pair movements.

Price Action:

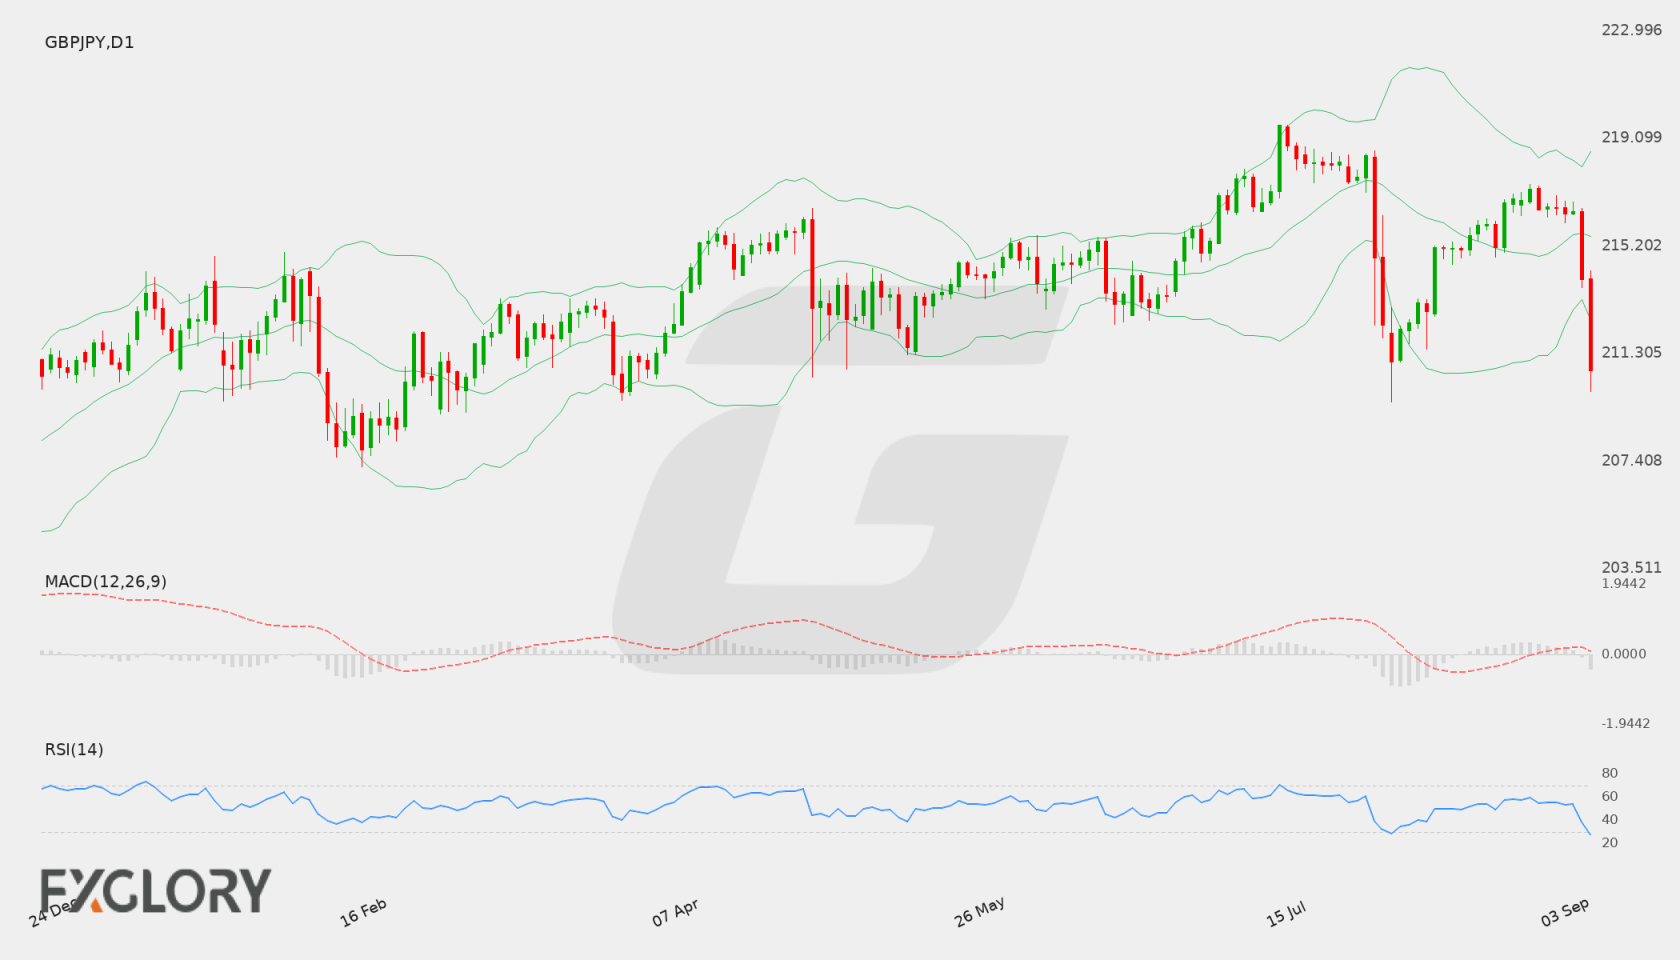
GBP/JPY experienced sharp selling pressure on the daily (D1) chart, falling from recent trading levels around 216.43 to close at 210.706. Consecutive strong red candlesticks demonstrate aggressive short-term downside momentum.

Key Technical Indicators:

Bollinger Bands: The pair has pushed below the lower Bollinger Band at 212.4857, indicating expanded volatility to the downside. The middle band sits at 215.5485, while the upper band is located at 218.6112.

RSI: The 14-day RSI is currently reading 27.66, placing GBP/JPY in oversold territory below the 30 threshold. This suggests that while selling pressure has been intense, the pair may be stretched in the short term.

MACD: The MACD indicator is in negative territory at -0.3233. This negative signal confirms ongoing bearish momentum following the pair's sudden downward extension.

Support and Resistance:

Key technical support is located at 209.539, which represents a crucial floor on the daily timeframe. Major resistance is positioned higher at 219.582, with dynamic resistance near the middle Bollinger Band at 215.5485.

News to Watch for GBPJPY This Week:

  • GDP m/m: This economic indicator reflects monthly output changes in the UK economy and can impact sentiment toward the British Pound.

Weekly Outlook and Consideration:

The daily timeframe for GBP/JPY presents a strong bearish bias following a drop toward 210.706. Trading below the lower Bollinger Band (212.4857) alongside a negative MACD of -0.3233 highlights persistent selling momentum. However, with the 14-day RSI in oversold territory at 27.66, price action may stall or consolidate as it approaches key support at 209.539 before establishing its next direction.

Disclaimer: The analysis provided for GBP/JPY is for informational purposes only and does not constitute investment advice. Traders are encouraged to perform their own analysis and research before making any trading decisions. Market conditions can change quickly, so staying informed with the latest data is essential.

GBP/JPY D1 technical analysis chart
GBP/JPY D1 Technical Analysis for 09.05.2026

GBP/JPY Forecast — 22 August 2026

Time Zone: GMT +3

Time Frame: Daily (D1) / Weekly Outlook

Weekly Fundamental Overview:

The GBP/JPY pair continues to navigate macroeconomic drivers from both the United Kingdom and Japan. Traders remain focused on central bank policy expectations, interest rate differentials, and global market risk sentiment influencing both currencies.

Price Action:

On the daily chart (D1), GBP/JPY closed at 216.775. The pair has demonstrated a notable recovery after testing lower levels earlier, pushing back into higher ground over recent daily sessions.

Key Technical Indicators:

Bollinger Bands: The daily Bollinger Bands feature a middle band at 215.029, an upper band at 219.206, and a lower band at 210.852. Price action trading at 216.775 positions the pair in the upper region of the band structure above the mid-band.

RSI: The 14-period Relative Strength Index (RSI) registers at 57.15, signaling moderate bullish momentum while remaining within neutral to constructive territory.

MACD: The MACD indicator is currently recorded at -0.0256. Staying slightly below the zero threshold, it indicates that historical downside pressure is leveling off as price stabilizes.

Support and Resistance:

Key daily technical resistance is positioned at 219.582, while main technical support is observed at 209.539.

News to Watch for GBPJPY This Week:

  • Tokyo Core CPI y/y: This key inflation release provides critical insight into Japanese price trends and potential monetary policy adjustments.

Weekly Outlook and Consideration:

The weekly technical outlook for GBP/JPY remains constructive following its rise to 216.775, keeping price above the daily Bollinger middle band at 215.029. With an RSI at 57.15 supporting positive momentum, buyers may eye key resistance at 219.582, whereas primary support at 209.539 serves as a key downside boundary.

Disclaimer: The analysis provided for GBP/JPY is for informational purposes only and does not constitute investment advice. Traders are encouraged to perform their own analysis and research before making any trading decisions. Market conditions can change quickly, so staying informed with the latest data is essential.

1GBP = –––JPY –––% ▼
GBPJPY
Loading chart...