Time Zone: GMT +3
Time Frame: Daily (D1) / Weekly Outlook
Weekly Fundamental Overview:
Economic activity figures and market risk sentiment remain central to the CAD/CHF pair. Movements in relative central bank expectations alongside Canadian macroeconomic data shape the trajectory for the Canadian Dollar against the Swiss Franc.
Price Action:
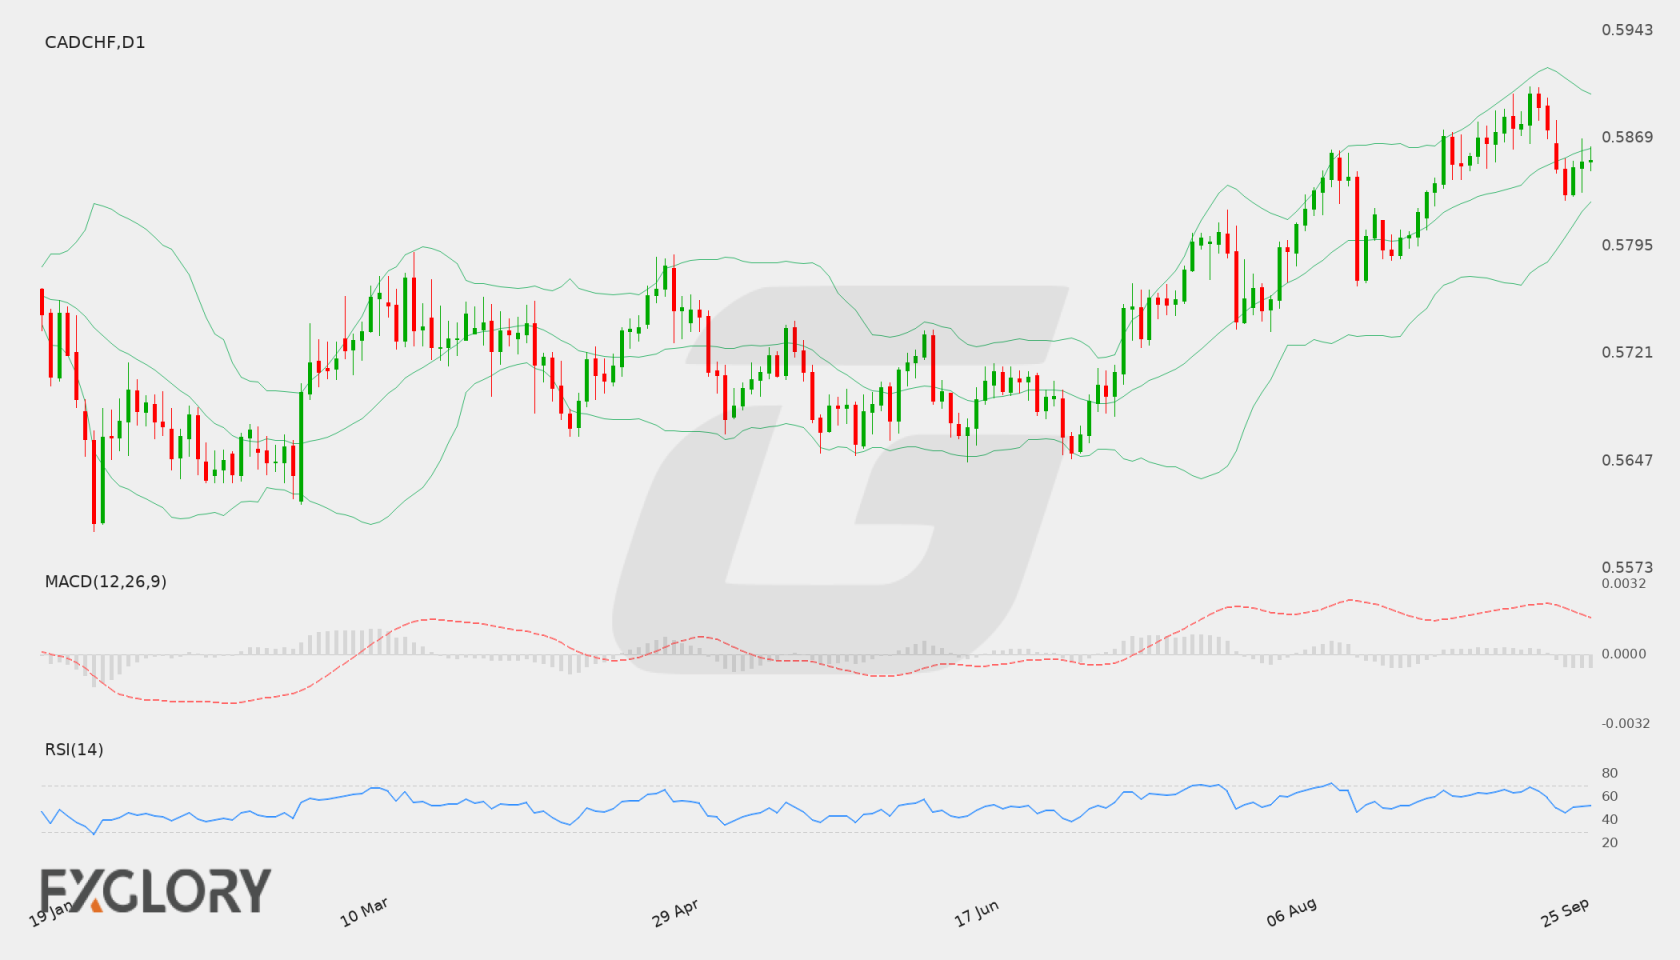
On the daily (D1) chart, CAD/CHF recently closed at 0.58542 after consolidating near recent session highs. The pair demonstrated a pullback from peak levels near 0.58997 down to a low of 0.58310 before stabilizing around current levels.
Key Technical Indicators:
Bollinger Bands: The price of CAD/CHF is hovering near the middle Bollinger Band at 0.58626. The upper Bollinger Band is positioned at 0.58997, marking upper dynamic resistance, while the lower band at 0.58255 serves as technical support.
RSI: The 14-day RSI stands at 52.27, placing CAD/CHF in neutral territory without strong overbought or oversold signals.
MACD: The D1 MACD indicator is currently reading 0.00104, remaining slightly above the baseline and reflecting mild positive momentum despite recent price consolidation.
Support and Resistance:
Key technical levels for CAD/CHF include primary support at 0.56521 and horizontal resistance at 0.59048, framing the major high and low boundaries on the chart.
News to Watch for CADCHF This Week:
- GDP m/m: This monthly economic release measures Canadian growth and can influence demand for the Canadian Dollar.
Weekly Outlook and Consideration:
CAD/CHF is trading in a consolidated range around 0.58542. Technical indicators show a neutral-to-slightly bullish bias, with RSI at 52.27 and MACD in positive territory at 0.00104. A push higher could see price test the upper Bollinger Band near 0.58997 and key resistance at 0.59048. Conversely, downward momentum may push CAD/CHF toward the lower Bollinger Band at 0.58255, with major structural support situated at 0.56521. Upcoming economic data releases will be critical in determining near-term direction.
Disclaimer: The analysis provided for CAD/CHF is for informational purposes only and does not constitute investment advice. Traders are encouraged to perform their own analysis and research before making any trading decisions. Market conditions can change quickly, so staying informed with the latest data is essential.