Time Zone: GMT +3
Time Frame: Daily (D1) / Weekly Outlook
Weekly Fundamental Overview:
The CAD/CHF currency pair reflects market sentiment surrounding the Canadian economy alongside the relative stability of the Swiss Franc. While broader commodity trends and risk appetite often influence the Canadian dollar, Swiss Franc valuation remains sensitive to global risk conditions. Traders monitor fiscal disclosures and broader economic developments to evaluate potential momentum in CAD/CHF.
Price Action:
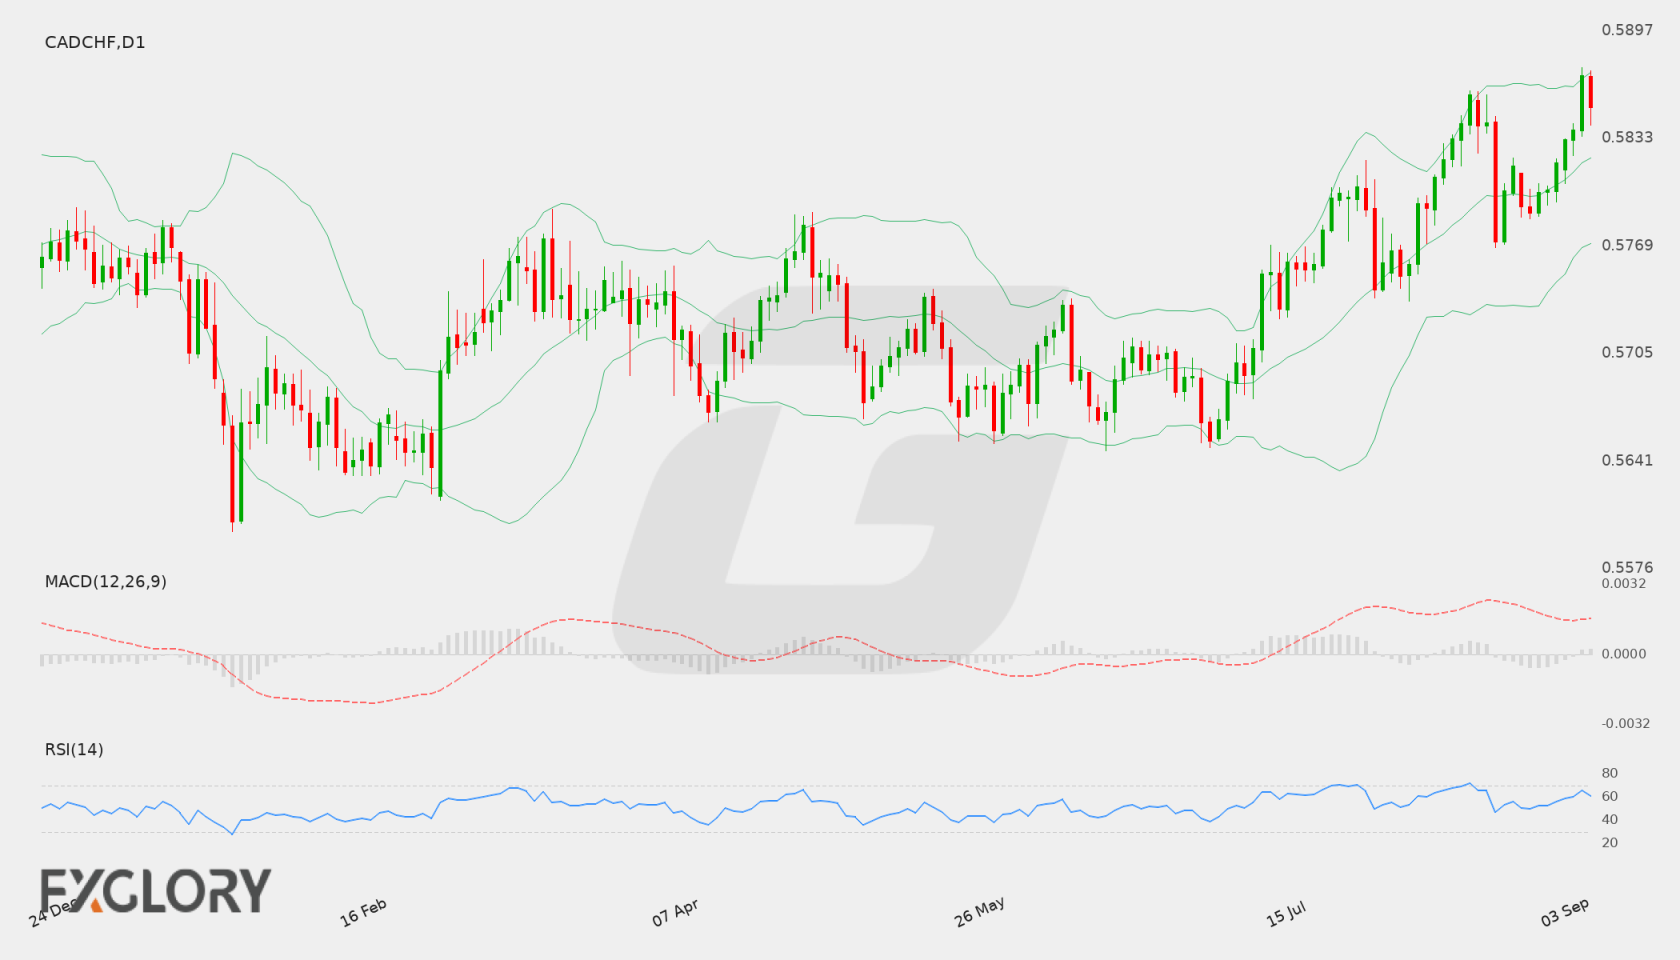
On the daily (D1) chart, CAD/CHF has displayed upward momentum, moving from lower consolidation areas toward recent highs near 0.58752 before settling at 0.58521. The sequence of higher session closes indicates prevailing short-term buying interest across recent trading periods.
Key Technical Indicators:
Bollinger Bands: The daily Bollinger Bands show a middle band at 0.58213, an upper band at 0.58724, and a lower band at 0.57701. With the last close at 0.58521, CAD/CHF trades in the upper half of the band structure, reflecting steady upward pressure.
RSI: The 14-day Relative Strength Index (RSI) is at 60.35, positioning above the key 50 mark. This reading confirms bullish control while leaving room before reaching overbought territory above 70.
MACD: The MACD indicator on the D1 timeframe stands at 0.00186, holding in positive territory. This configuration signals ongoing bullish sentiment without immediate indications of momentum exhaustion.
Support and Resistance:
Key technical levels for CAD/CHF establish immediate resistance at 0.58752, near recent daily highs. On the downside, primary support is situated at 0.56464, with intermediate dynamic support aligned with the middle Bollinger Band at 0.58213.
News to Watch for CADCHF This Week:
- Annual Budget Release: This fiscal announcement outlines government spending plans and economic projections that could influence sentiment surrounding the Canadian currency.
Weekly Outlook and Consideration:
CAD/CHF maintains a constructive technical structure on the daily timeframe, with price action holding at 0.58521 above the 0.58213 middle Bollinger Band. Coupled with an RSI of 60.35 and a positive MACD value of 0.00186, market conditions suggest continued interest from buyers testing the key resistance level at 0.58752. Should resistance hold, a modest pull back toward the middle band may occur, whereas a broader downturn would highlight support near 0.56464.
Disclaimer: The analysis provided for CAD/CHF is for informational purposes only and does not constitute investment advice. Traders are encouraged to perform their own analysis and research before making any trading decisions. Market conditions can change quickly, so staying informed with the latest data is essential.