Time Zone: GMT +3
Time Frame: Daily (D1) / Weekly Outlook
Weekly Fundamental Overview:
The fundamental environment for AUD/USD is influenced by central bank communications from Australia alongside key economic activity indicators from the United States. Traders are closely monitoring the economic outlook from the Reserve Bank of Australia and US manufacturing trends to gauge potential shifting interest rate expectations and broad risk sentiment across global currency markets.
Price Action:
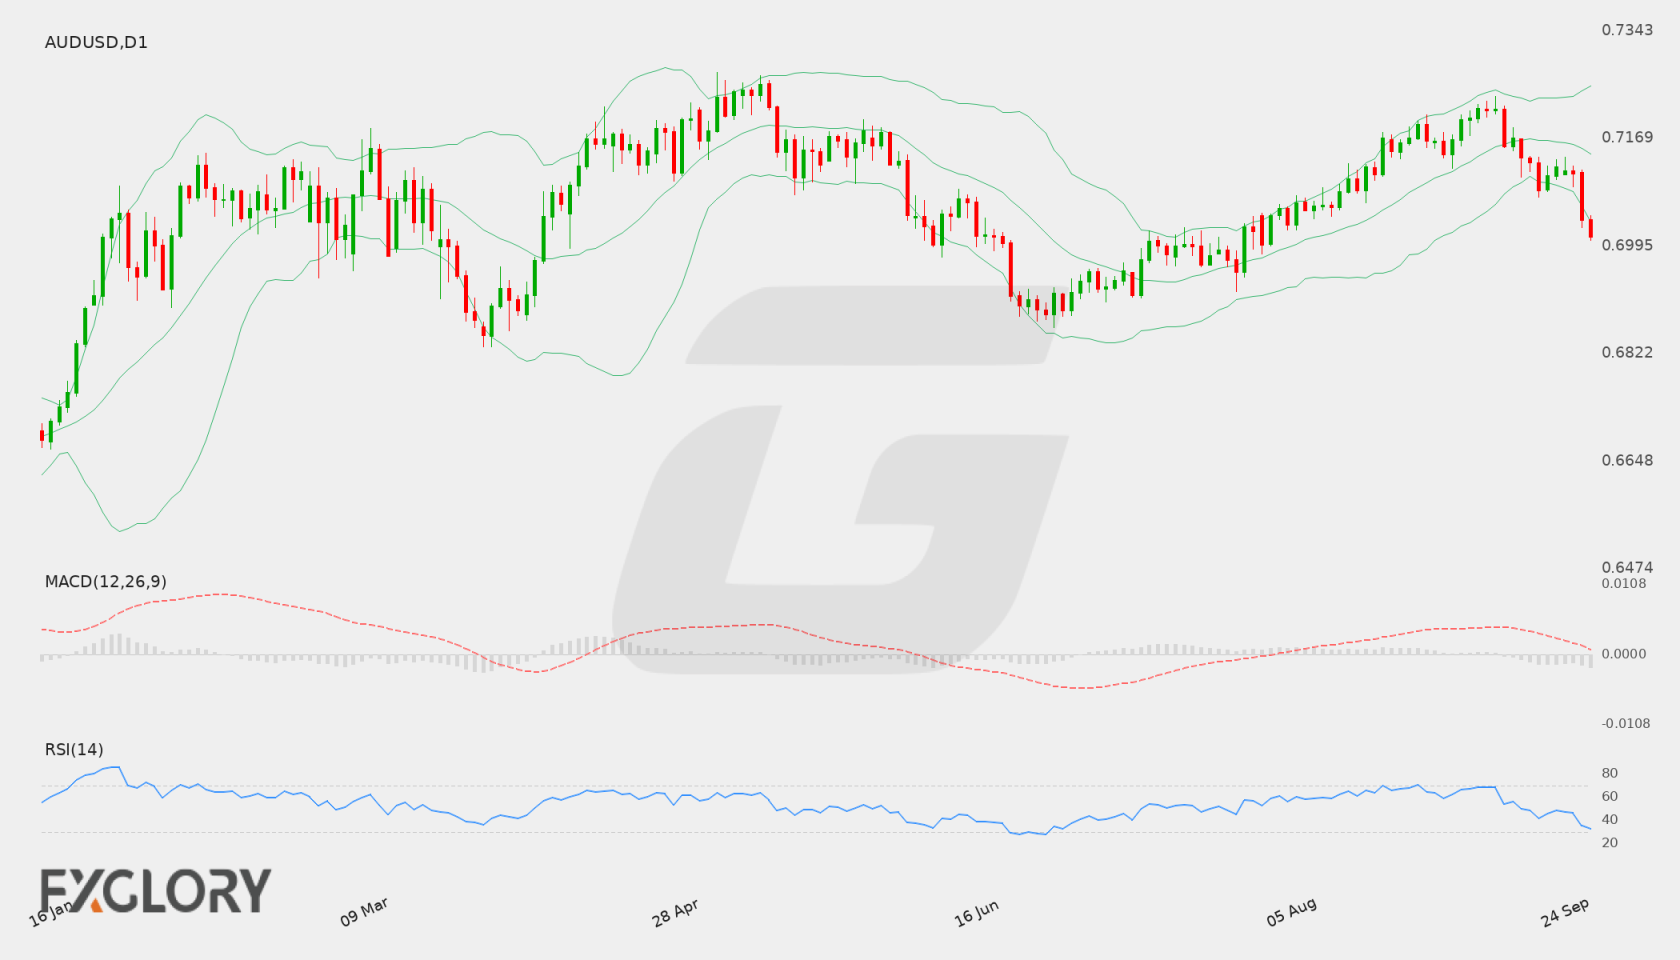
On the Daily (D1) chart, AUD/USD (AUDUSD) has exhibited persistent downward movement over recent trading sessions. Price action shows a decline from recent higher levels above 0.7200, eventually bringing the currency pair down to close at 0.70109, maintaining a clear short-term bearish tone.
Key Technical Indicators:
Bollinger Bands: The Bollinger Bands display a middle band around 0.71440, with the upper band positioned at 0.72537 and the lower band at 0.70343. The latest daily close of 0.70109 has breached below the lower band, signaling intense downside selling momentum and potential extension past standard volatility boundaries.
RSI: The 14-day Relative Strength Index (RSI) stands at 32.49. Moving close to the oversold threshold of 30, the indicator highlights strong prevailing downward momentum while suggesting that heavy selling could eventually trigger technical consolidation.
MACD: The Moving Average Convergence Divergence (MACD) line registers at -0.00129. Remaining in negative territory below the zero line, the MACD reinforces the ongoing bearish momentum currently dominating daily price developments.
Support and Resistance:
Key technical benchmarks for AUD/USD identify primary support at 0.69052, which serves as a major downside target should selling continue. On the upside, overhead resistance is situated at 0.72364, marking a significant barrier for any prospective bullish recoveries.
News to Watch for AUDUSD This Week:
- RBA Press Conference: Provides insights into the monetary policy stance and economic projections of the Australian central bank.
- ISM Manufacturing PMI: Measures operational health in the US manufacturing sector to offer direction on US economic strength.
- ISM Manufacturing Prices: Highlights inflation dynamics within US manufacturing supply chains that could influence monetary policy.
Weekly Outlook and Consideration:
The weekly technical outlook for AUD/USD remains leaning toward the downside based on Daily chart signals. The pair closed at 0.70109, breaking below the lower Bollinger Band (0.70343) while supported by a negative MACD of -0.00129 and an RSI reading of 32.49. Continued selling pressure may drive price action toward the primary support level at 0.69052. Conversely, if oversold conditions prompt a corrective bounce, initial upside momentum could aim back toward the middle Bollinger Band near 0.71440 before approaching the main resistance level at 0.72364. Upcoming economic updates like the RBA Press Conference and US manufacturing reports will be critical factors determining market direction.
Disclaimer: The analysis provided for AUD/USD is for informational purposes only and does not constitute investment advice. Traders are encouraged to perform their own analysis and research before making any trading decisions. Market conditions can change quickly, so staying informed with the latest data is essential.