
AUDJPY Forecast

AUD iconJPY icon
AUD/JPY

Australian Dollar vs Japanese Yen

AUD/JPY Live Price

110.43700
+0.21%

AUD/JPY Forecast — 28 September 2026

Time Zone: GMT +3

Time Frame: Daily (D1) / Weekly Outlook

Weekly Fundamental Overview:

The AUD/JPY pair reflects market dynamics between risk-sensitive Australian dollar sentiment and Japanese yen demand. Economic developments in Australia alongside shifts in global risk sentiment continue to guide price developments, with central bank policy stances remaining a key factor for traders monitoring potential market direction.

Price Action:

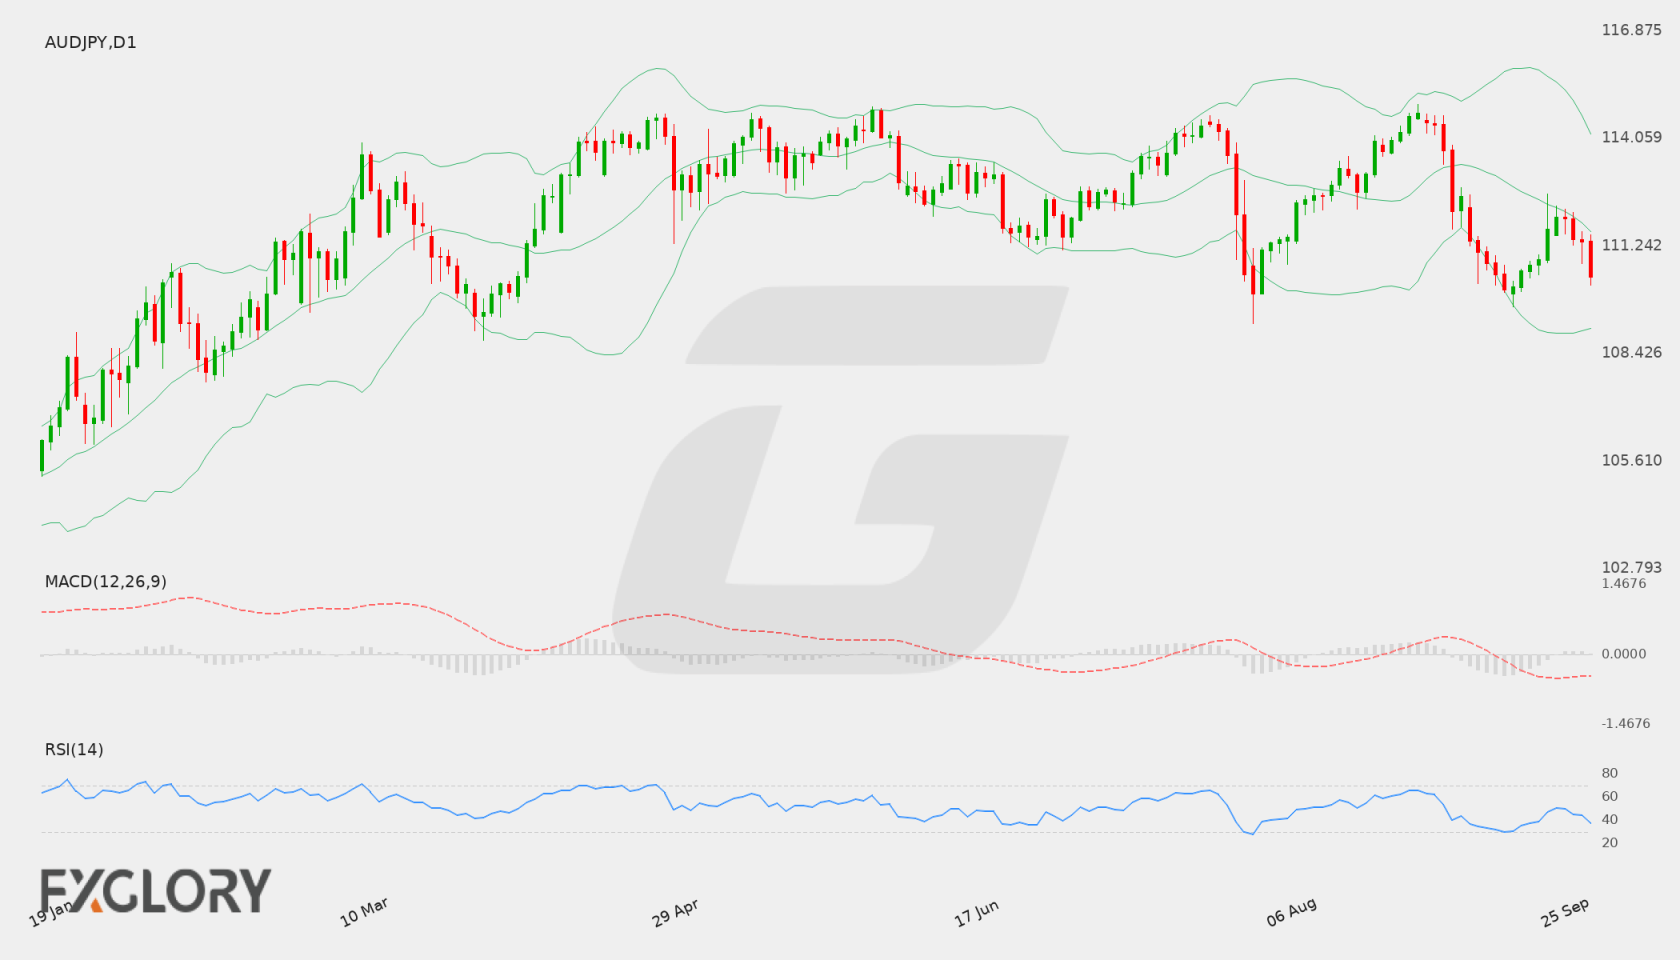
On the daily (D1) chart, AUD/JPY has recently retreated from peak levels around 114.72 to close at 110.433. The daily series shows consecutive lower closes, pointing to short-term selling pressure as price approaches lower technical boundaries.

Key Technical Indicators:

Bollinger Bands: The D1 Bollinger Bands show a middle line at 111.625, an upper band at 114.174, and a lower band at 109.076. Trading at 110.433 positions AUD/JPY below the middle band, signaling bearish bias while staying above lower band support.

RSI: The 14-day Relative Strength Index (RSI) stands at 37.15. This reading suggests bearish market control while remaining above the traditional oversold threshold of 30.

MACD: The D1 MACD indicator records a reading of -0.448, remaining in negative territory. This momentum indicator reflects ongoing downward pressure, though traders watch for any slowing in bearish momentum.

Support and Resistance:

Key technical levels on the daily time frame include primary support near 109.212 and immediate resistance around 114.938. The Bollinger lower band near 109.076 also serves as dynamic support.

News to Watch for AUDJPY This Week:

  • RBA Press Conference: Remarks from central bank leadership could provide essential guidance on monetary policy and economic expectations affecting the Australian dollar.

Weekly Outlook and Consideration:

The weekly outlook for AUD/JPY remains cautious given daily technical metrics. With RSI at 37.15 and MACD at -0.448, bearish sentiment persists while price action stays below the 111.625 middle Bollinger band. A hold near the 109.212 support level could allow for potential stabilization, whereas a break higher would require conquering resistance near 114.938.

Disclaimer: The analysis provided for AUD/JPY is for informational purposes only and does not constitute investment advice. Traders are encouraged to perform their own analysis and research before making any trading decisions. Market conditions can change quickly, so staying informed with the latest data is essential.
AUD/JPY D1 technical analysis chart
AUD/JPY D1 Technical Analysis for 09.28.2026

AUD/JPY Forecast — 20 September 2026

Time Zone: GMT +3

Time Frame: Daily (D1) / Weekly Outlook

Weekly Fundamental Overview:

The AUD/JPY pair navigates a monetary policy environment shaped by Reserve Bank of Australia interest rate decisions and Japanese inflation dynamics. Differentials in monetary policy expectations between Australia and Japan continue to impact sentiment and cross-currency interest.

Price Action:

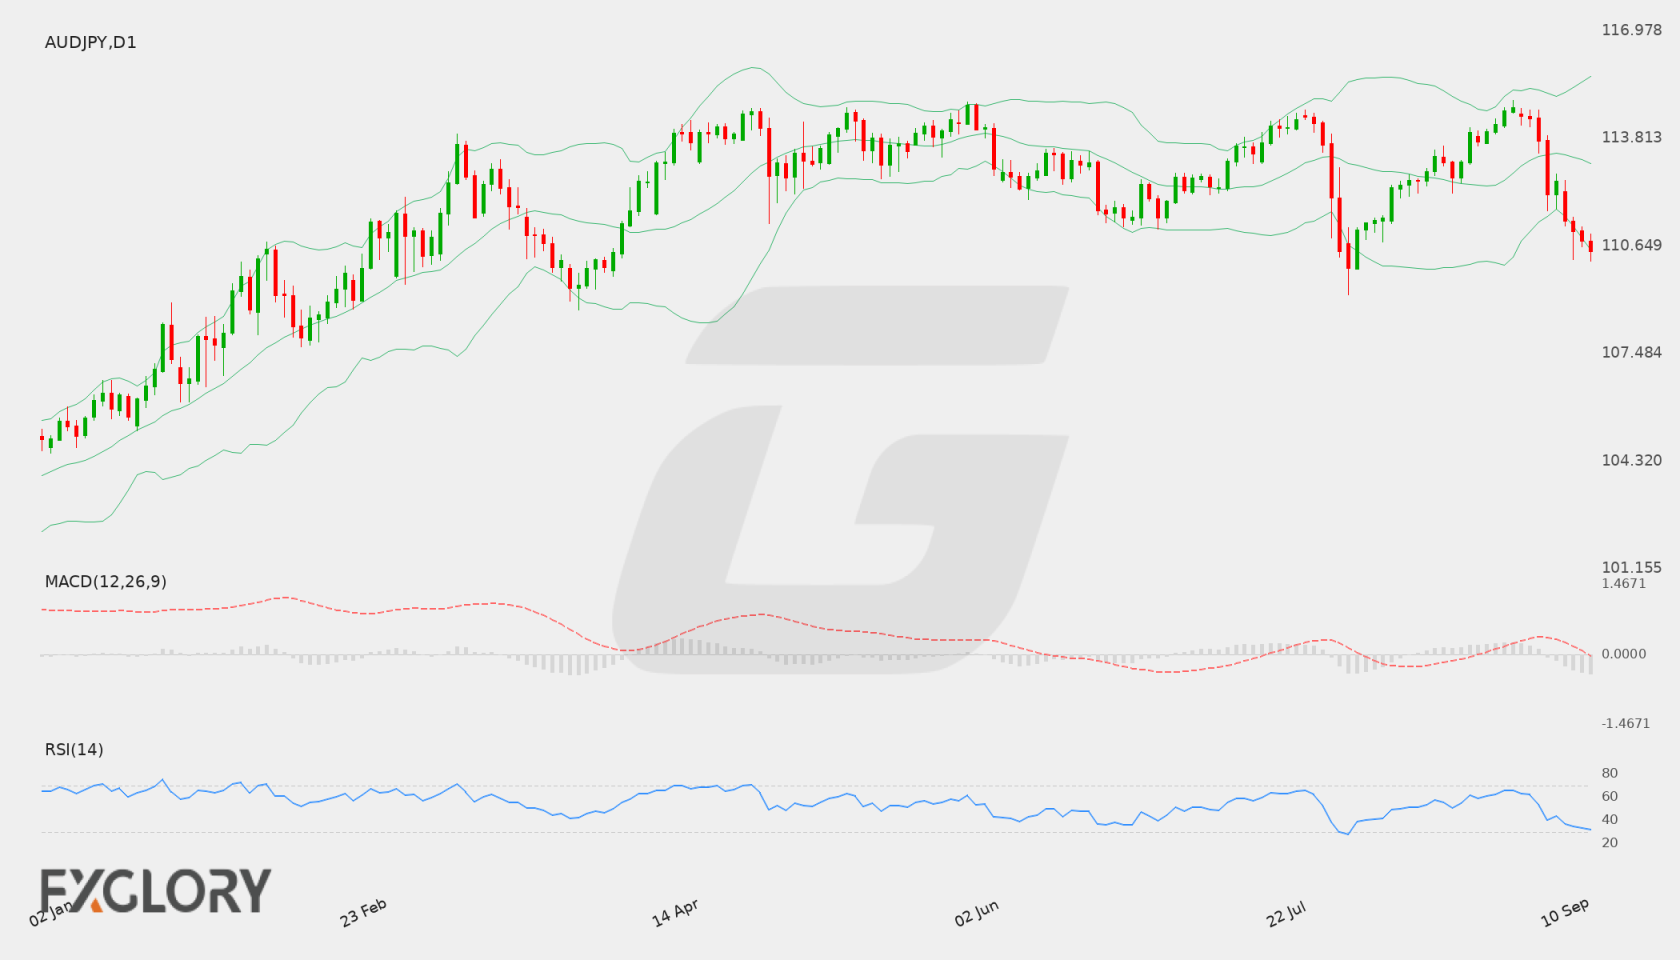
Daily chart price action shows AUD/JPY recently closing around 110.885 after retreating from high levels near resistance at 114.938. The pair has tested lower ranges, staying above the main technical support zone at 109.212.

Key Technical Indicators:

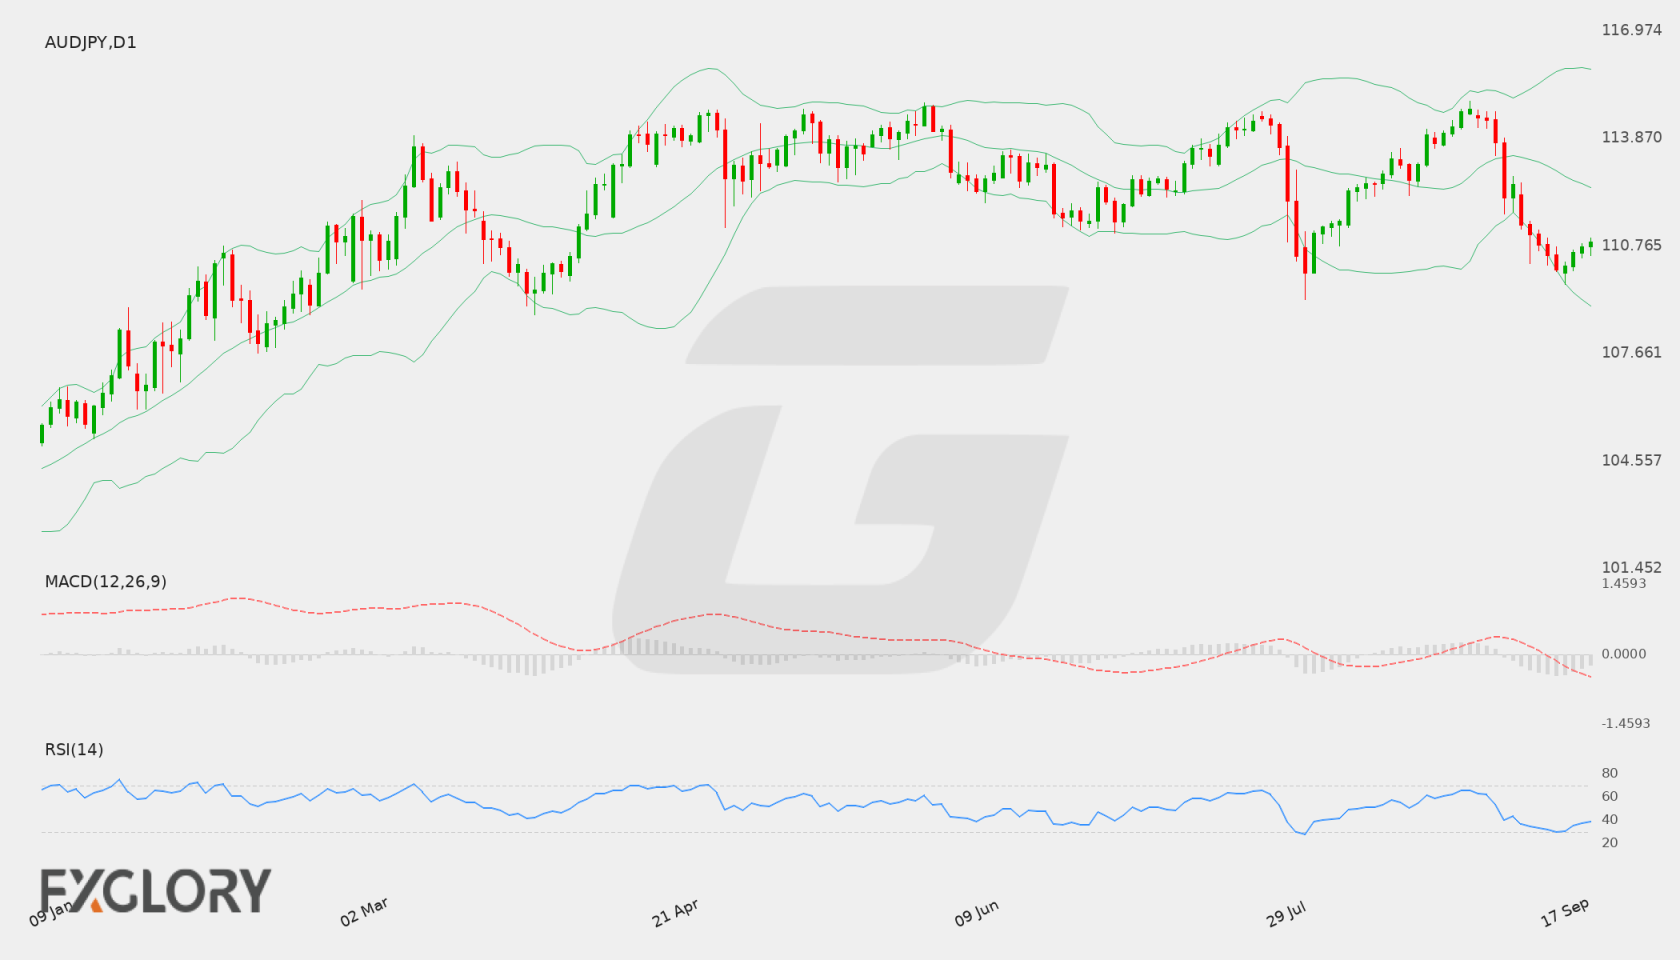
Bollinger Bands: Bollinger Bands on the daily chart reflect a middle line at approximately 112.447, an upper band near 115.858, and a lower band near 109.036. Price action trading below the middle line towards the lower band reflects a downward bias.

RSI: The 14-period Relative Strength Index (RSI) stands at 38.79, indicating subdued buying pressure and positioning the oscillator in a neutral-to-oversold region.

MACD: The MACD indicator is currently reading -0.698, remaining in negative territory. This negative value indicates persistent downside momentum on the daily timeframe.

Support and Resistance:

Key technical support for AUD/JPY is noted at 109.212, which serves as potential downside floor. Upside resistance stands at 114.938, marking a key barrier for bullish recovery attempts.

News to Watch for AUDJPY This Week:

  • Cash Rate: This interest rate announcement provides key momentum for Australian monetary policy expectations.
  • RBA Rate Statement: The official statement outlines economic perspectives and monetary policy guidance.
  • RBA Press Conference: Commentary from central bank officials offers additional clarity on economic trends.
  • CPI y/y: Annual price changes provide crucial insights into domestic inflationary pressures.
  • Trimmed Mean CPI m/m: Core monthly inflation data helps assess underlying price strength.
  • CPI m/m: Monthly consumer price figures measure short-term shifts in inflation.
  • Tokyo Core CPI y/y: Japanese inflation data acts as a key leading indicator for national price developments.

Weekly Outlook and Consideration:

For the coming week, AUD/JPY price action will likely revolve around the key technical support at 109.212 and resistance at 114.938. Technical signals such as a negative MACD and an RSI of 38.79 reflect weak upside momentum. High-impact Australian central bank events and Japanese inflation metrics could drive market volatility around key chart levels.

Disclaimer: The analysis provided for AUD/JPY is for informational purposes only and does not constitute investment advice. Traders are encouraged to perform their own analysis and research before making any trading decisions. Market conditions can change quickly, so staying informed with the latest data is essential.
AUD/JPY D1 technical analysis chart
AUD/JPY D1 Technical Analysis for 09.20.2026

AUD/JPY Forecast — 12 September 2026

Time Zone: GMT +3

Time Frame: Daily (D1) / Weekly Outlook

Weekly Fundamental Overview:

Broader risk sentiment and monetary policy developments involving central banks remain primary drivers for AUD/JPY (AUDJPY), with traders monitoring macroeconomic trends and yield differentials for directional cues.

Price Action:

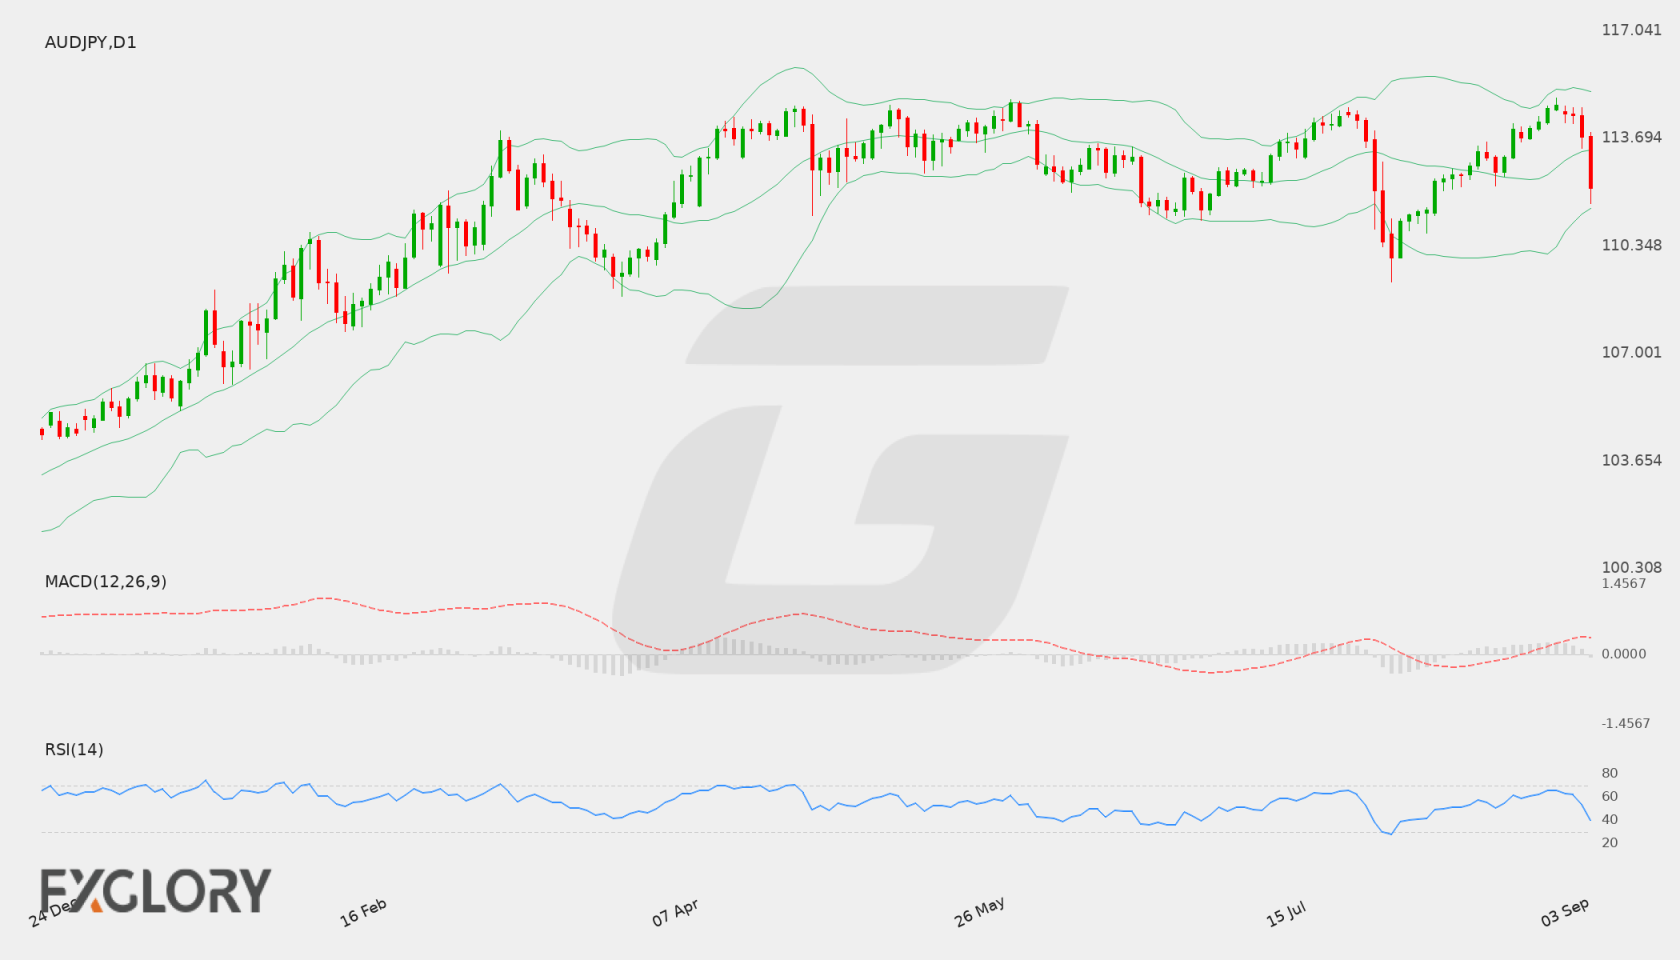
On the Daily (D1) timeframe, AUD/JPY (AUDJPY) has moved sharply lower in recent sessions, descending from above the 114.00 level down toward a recent close of 110.51, reflecting continuous downside pressure.

Key Technical Indicators:

Bollinger Bands: The D1 Bollinger Bands show the pair trading right at the lower band of 110.519, well below the middle band at 113.073 and upper band at 115.627, pointing to elevated downward volatility.

RSI: The 14-day RSI stands at 31.67, lingering near oversold territory and pointing to intense selling momentum that may eventually prompt consolidation or a technical pause.

MACD: The MACD indicator registers at -0.448, holding below its zero line to indicate that bearish momentum currently controls the broader daily structure for AUD/JPY (AUDJPY).

Support and Resistance:

Immediate key technical support for AUD/JPY (AUDJPY) is positioned at 109.212, while primary resistance sits higher at 114.938.

News to Watch for AUDJPY This Week:

  • Monetary Policy Statement: Detailed policy assessments within this statement provide insight into economic projections and future policy adjustments.
  • BOJ Press Conference: Statements delivered during this press event offer crucial guidance regarding interest rate trajectories and economic outlooks.
  • BOJ Policy Rate: Benchmark interest rate decisions directly influence currency valuations and broader capital flow movements.

Weekly Outlook and Consideration:

AUD/JPY (AUDJPY) enters the week facing ongoing downward pressure, with the daily close of 110.51 sitting directly at the lower Bollinger Band of 110.519. The MACD reading of -0.448 underscores active bearish momentum, while an RSI of 31.67 signals that price action is approaching oversold territory. Should selling pressure persist, the market could test primary support around 109.212. Alternatively, a relief pullback could see the pair move back toward the middle Bollinger Band at 113.073 before potentially challenging major resistance near 114.938.

Disclaimer: The analysis provided for AUD/JPY is for informational purposes only and does not constitute investment advice. Traders are encouraged to perform their own analysis and research before making any trading decisions. Market conditions can change quickly, so staying informed with the latest data is essential.
AUD/JPY D1 technical analysis chart
AUD/JPY D1 Technical Analysis for 09.12.2026

AUD/JPY Forecast — 5 September 2026

Time Zone: GMT +3

Time Frame: Daily (D1) / Weekly Outlook

Weekly Fundamental Overview:

Market sentiment for AUD/JPY is driven by shifting interest rate expectations and global risk appetite. Traders continue to monitor economic dynamics in Australia alongside potential policy adjustments in Japan.

Price Action:

The daily chart for AUD/JPY displays a sharp pullback from recent peaks near 114.72, dropping to a recent close of 112.168. Price action indicates active selling pressure following several consecutive downward daily sessions.

Key Technical Indicators:

Bollinger Bands: Bollinger Bands on the daily timeframe show a middle line at 113.326, an upper band at 115.148, and a lower band at 111.504. AUD/JPY has broken below the middle line and is currently trading closer to the lower band.

RSI: The 14-day Relative Strength Index (RSI) is positioned at 40.03. This puts AUD/JPY below the neutral 50 level, indicating growing bearish strength while remaining above oversold territory.

MACD: The MACD indicator currently stands at 0.287. Although it remains in positive territory, the recent sharp downward price move indicates waning bullish momentum.

Support and Resistance:

Key technical levels for AUD/JPY indicate primary support at 109.212 and key resistance at 114.938.

News to Watch for AUDJPY This Week:

  • BOJ Policy Rate: This interest rate decision provides crucial insight into potential monetary policy adjustments affecting market sentiment.
  • BOJ Press Conference: Statements from bank officials can offer key guidance regarding economic outlook and future rate trajectories.
  • Monetary Policy Statement: Detailed policy assessments outline central bank policy directives and influence trading dynamics.

Weekly Outlook and Consideration:

AUD/JPY faces increased downside pressure following a decline from resistance near 114.938 toward 112.168. With price action trading below the Bollinger middle band of 113.326 and the RSI at 40.03, market indicators point to a cautious short-term bias. Further sustained selling could lead price action toward support at 109.212, whereas a recovery above 113.326 would be needed to stabilize the pair.

Disclaimer: The analysis provided for AUD/JPY is for informational purposes only and does not constitute investment advice. Traders are encouraged to perform their own analysis and research before making any trading decisions. Market conditions can change quickly, so staying informed with the latest data is essential.

AUD/JPY D1 technical analysis chart
AUD/JPY D1 Technical Analysis for 09.05.2026

AUD/JPY Forecast — 22 August 2026

Time Zone: GMT +3

Time Frame: Daily (D1) / Weekly Outlook

Weekly Fundamental Overview:

The AUD/JPY currency pair continues to be driven by shifting expectations surrounding Australian monetary policy and Japan’s inflation backdrop. Traders remain focused on incoming consumer price updates from Australia, which could alter interest rate expectations for the Reserve Bank of Australia. Meanwhile, Japanese inflation metrics remain critical in evaluating potential policy adjustments by the Bank of Japan. Broader market risk sentiment and commodity trends also play a key role in dictating price swings for AUD/JPY.

Price Action:

On the Daily (D1) chart, AUD/JPY recently recovered from a swing low near the 109.212 support level and rose toward its last close of 113.117. Price action reflects a series of higher daily closes following a pullback, indicating renewed buying interest. However, price continues to trade within a broader range below the 114.891 resistance level.

Key Technical Indicators:

Bollinger Bands: The Daily Bollinger Bands display a middle band at 112.478, an upper band at 114.894, and a lower band at 110.062. With AUD/JPY closing at 113.117, price is positioned above the middle band, reflecting a modest bullish bias while remaining well beneath the upper volatility boundary.

RSI: The 14-period Relative Strength Index (RSI) stands at 54.79. This value indicates neutral-to-slightly bullish sentiment, offering room for price movement in either direction without immediate overbought constraints.

MACD: The MACD indicator registers a reading of 0.0336, remaining slightly above the zero line. This indicates mild positive momentum, though the small value suggests a lack of aggressive trend direction at present.

Support and Resistance:

Key daily technical levels for AUD/JPY establish primary resistance at 114.891 and strong support at 109.212. Additionally, the Bollinger middle band at 112.478 serves as an intermediate dynamic support area on pullbacks.

News to Watch for AUDJPY This Week:

  • CPI m/m: Tracks monthly consumer price shifts in Australia that can heavily impact Reserve Bank of Australia rate expectations.
  • Trimmed Mean CPI m/m: Measures core Australian inflation trends to provide guidance on prospective monetary policy decisions.
  • CPI y/y: Reflects annual Australian price changes, providing a broader look at inflationary pressures affecting the Aussie dollar.
  • Tokyo Core CPI y/y: Serves as a key leading indicator for Japanese national inflation and potential Bank of Japan policy shifts.

Weekly Outlook and Consideration:

The weekly outlook for AUD/JPY leans mildly positive based on recent D1 price action holding above the 112.478 middle Bollinger band. If buyers maintain momentum, the pair may test key resistance near 114.891. Conversely, if fundamental releases trigger risk aversion or Yen strengthening, price could retrace toward dynamic support around 112.478, with major downside protection situated at 109.212.

Disclaimer: The analysis provided for AUD/JPY is for informational purposes only and does not constitute investment advice. Traders are encouraged to perform their own analysis and research before making any trading decisions. Market conditions can change quickly, so staying informed with the latest data is essential.

1AUD = –––JPY –––% ▼
AUDJPY
Loading chart...