
AUDCHF Forecast

AUD iconCHF icon
AUD/CHF

Australian Dollar vs Swiss Franc

AUD/CHF Live Price

0.58356
+0.23%

AUD/CHF Forecast — 28 September 2026

Time Zone: GMT +3

Time Frame: Daily (D1) / Weekly Outlook

Weekly Fundamental Overview:

Fundamental factors for AUD/CHF remain anchored in broader risk sentiment and differential monetary policy outlooks between Australia and Switzerland. As a commodity-linked asset, AUD responds heavily to global trade developments and domestic policy shifts, whereas CHF maintains safe-haven characteristics during times of market uncertainty. Market participants continue to evaluate central bank stances and global growth expectations for directional cues on the AUD/CHF pair.

Price Action:

On the daily (D1) chart, AUD/CHF recently pulled back from high levels near resistance at 0.58802 toward a local low of 0.58021 before recovering modestly to close at 0.58168. This price action reflects short-term consolidation following a prior upward movement, with buyers attempting to defend recent dips.

Key Technical Indicators:

Bollinger Bands: The Bollinger Bands indicator on the daily chart shows a middle band at 0.582908, an upper band at 0.586829, and a lower band at 0.578987. The recent close at 0.58168 positions AUD/CHF slightly below the middle band, suggesting a balanced phase within the volatility envelope.

RSI: The 14-period Relative Strength Index (RSI) stands at 53.22, placing AUD/CHF in a neutral region. This reading indicates balanced market momentum without immediate overbought or oversold signals on the daily timeframe.

MACD: The MACD indicator prints a positive value of 0.001850, staying above the zero line. This indicates that broader daily momentum continues to hold a mild bullish bias, despite recent short-term pullbacks in price.

Support and Resistance:

Key technical levels for AUDCHF include primary daily support at 0.55663 and key overhead resistance at 0.58802. Price interaction near these boundaries will be critical for defining the next trend direction.

News to Watch for AUDCHF This Week:

  • RBA Press Conference: Official statements regarding monetary policy and economic performance may influence market sentiment and AUD exchange rates.

Weekly Outlook and Consideration:

The weekly outlook for AUD/CHF points to a neutral-to-bullish consolidation environment. With the pair closing at 0.58168, near its middle Bollinger Band of 0.582908, the market shows equilibrium. The MACD at 0.001850 and RSI at 53.22 support a steady outlook. A firm move above resistance at 0.58802 could suggest renewed upside interest, while a slide below immediate lower band levels could lead price toward support at 0.55663.

Disclaimer: The analysis provided for AUD/CHF is for informational purposes only and does not constitute investment advice. Traders are encouraged to perform their own analysis and research before making any trading decisions. Market conditions can change quickly, so staying informed with the latest data is essential.
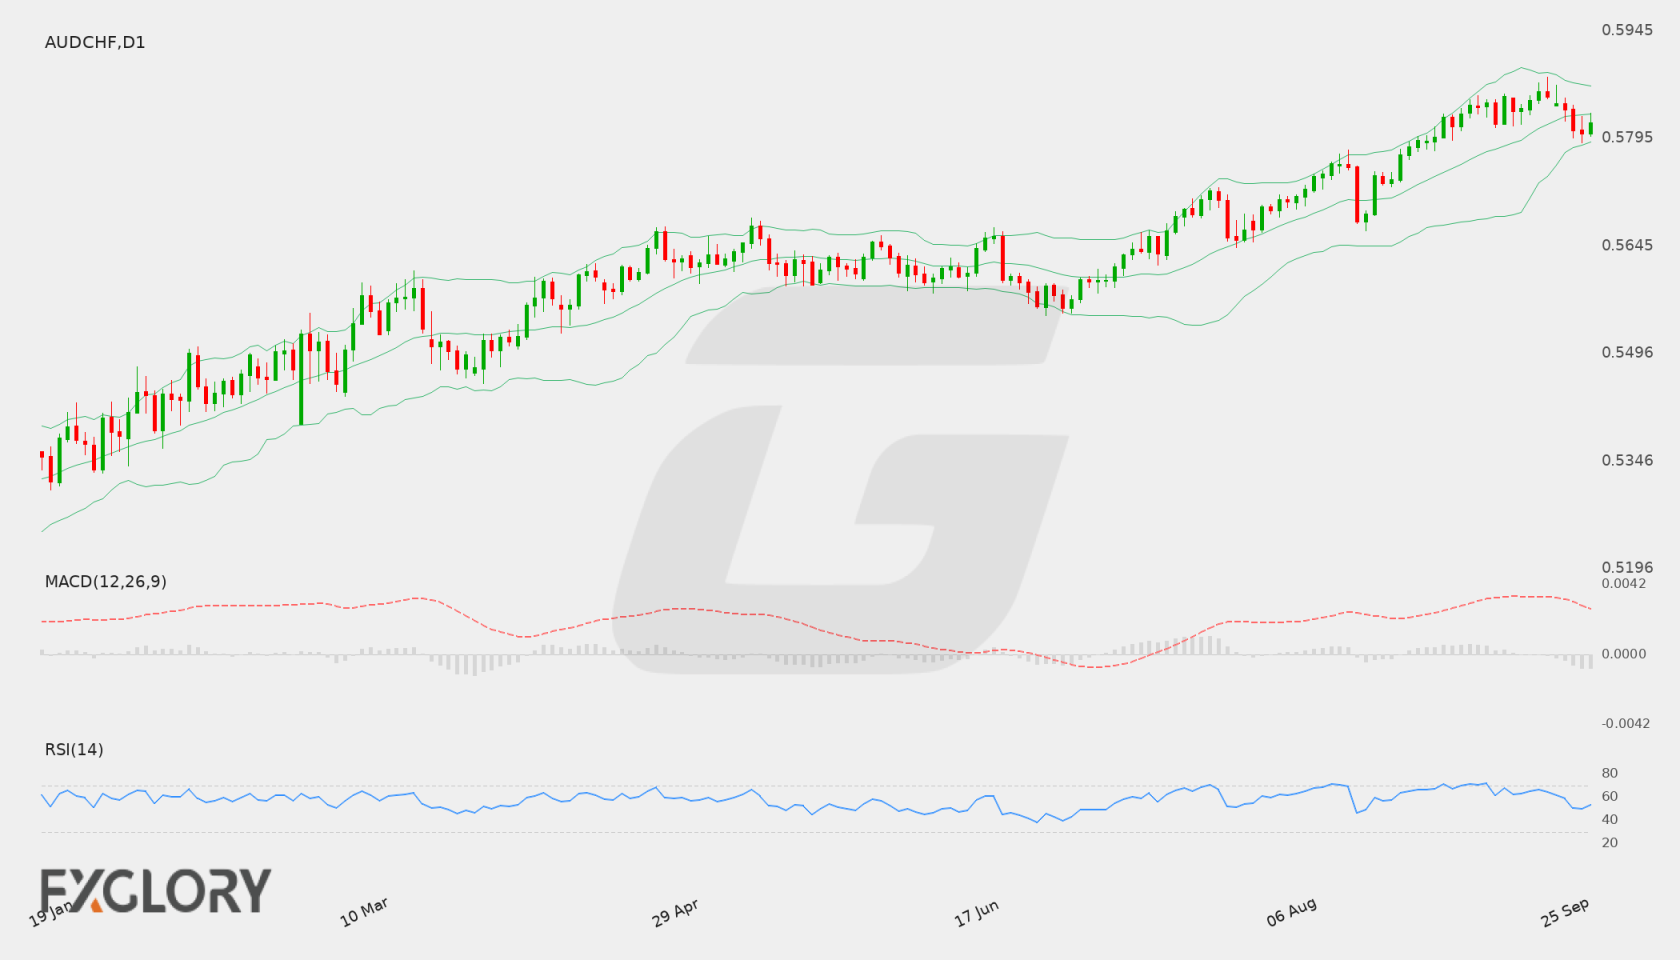
AUD/CHF D1 technical analysis chart
AUD/CHF D1 Technical Analysis for 09.28.2026

AUD/CHF Forecast — 20 September 2026

Time Zone: GMT +3

Time Frame: Daily (D1) / Weekly Outlook

Weekly Fundamental Overview:

The AUD/CHF currency pair remains influenced by monetary policy expectations from the Reserve Bank of Australia and economic conditions in Switzerland. Upcoming inflation metrics and central bank policy decisions are key fundamental drivers that could direct relative strength between the Australian dollar and the Swiss franc.

Price Action:

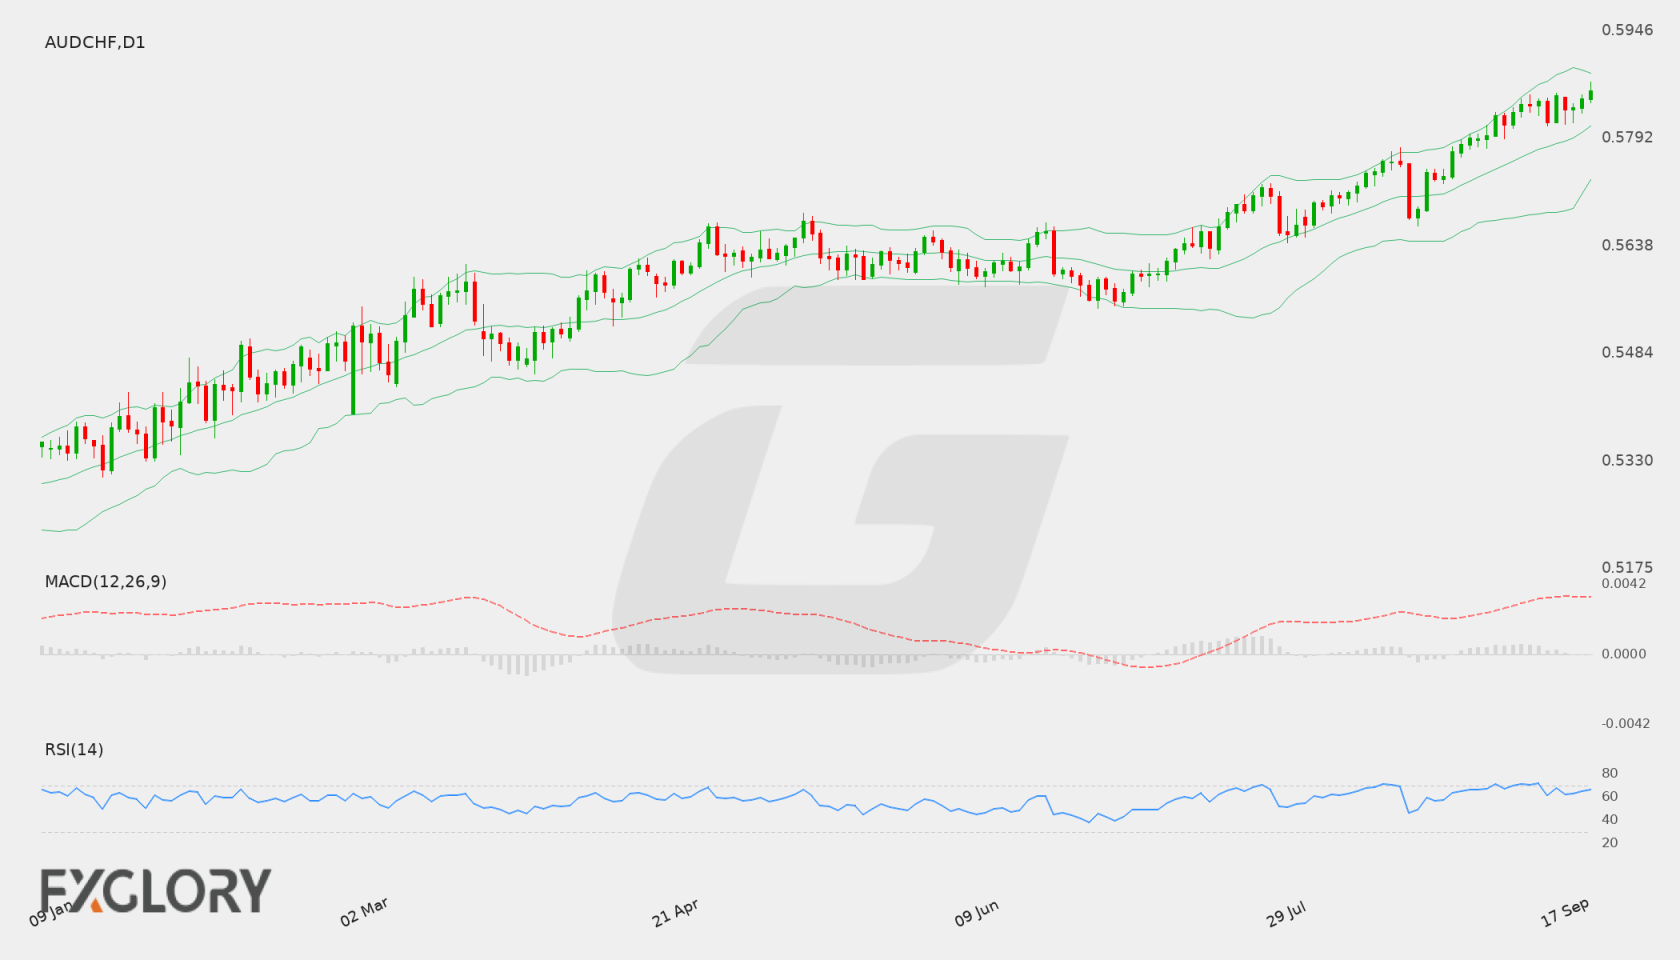
On the Daily (D1) chart, AUD/CHF has exhibited a steady upward trajectory, moving from lower levels around 0.55500 up toward a last close of 0.58598. Recent candles demonstrate strong buying interest, with the price testing a high near the recent resistance level of 0.58727.

Key Technical Indicators:

Bollinger Bands: The Bollinger Bands indicator shows the middle line at 0.58093, the upper band at 0.58858, and the lower band at 0.57327. AUD/CHF trades near the upper band, signaling sustained upward pressure within the band channel.

RSI: The 14-period Relative Strength Index (RSI) stands at 66.52, pointing toward firm bullish momentum without entering extreme overbought conditions.

MACD: The MACD indicator is currently positive at 0.00343, indicating sustained bullish momentum on the daily time frame as buyers remain in control of recent price movements.

Support and Resistance:

Technical support for AUD/CHF on the daily chart is situated at 0.55481, while primary resistance sits at 0.58727.

News to Watch for AUDCHF This Week:

  • Cash Rate: Official interest rate announcements influence broad sentiment and valuation for the Australian currency.
  • RBA Rate Statement: Policy statements provide detailed insights regarding monetary policy trajectories and economic forecasts.
  • RBA Press Conference: Central bank commentary provides clarity on economic outlooks and interest rate expectations.
  • CPI y/y: Annual consumer price index updates provide key measures of inflationary pressures influencing policy decisions.
  • Trimmed Mean CPI m/m: Core monthly inflation updates offer underlying views on underlying price trends.
  • CPI m/m: Monthly inflation figures provide critical indicators of shifting consumer prices.
  • CPI m/m: Swiss monthly inflation measures offer key insights into domestic price stability and Swiss franc interest rate expectations.

Weekly Outlook and Consideration:

AUD/CHF displays a positive bias on the D1 chart, with the price trading at 0.58598 near its upper Bollinger Band of 0.58858 and above the middle band of 0.58093. Supporting indicator values, including an RSI of 66.52 and a positive MACD of 0.00343, suggest ongoing bullish momentum. However, traders should monitor resistance at 0.58727 and major upcoming Australian inflation and central bank events for potential shifts in direction.

Disclaimer: The analysis provided for AUD/CHF is for informational purposes only and does not constitute investment advice. Traders are encouraged to perform their own analysis and research before making any trading decisions. Market conditions can change quickly, so staying informed with the latest data is essential.
AUD/CHF D1 technical analysis chart
AUD/CHF D1 Technical Analysis for 09.20.2026

AUD/CHF Forecast — 12 September 2026

Time Zone: GMT +3

Time Frame: Daily (D1) / Weekly Outlook

Weekly Fundamental Overview:

The AUD/CHF currency pair reflects market dynamic balances between risk sentiment linked to the Australian dollar and safe-haven flows tied to the Swiss franc. Upcoming domestic producer price data and general risk appetite remain key factors influencing price trajectory.

Price Action:

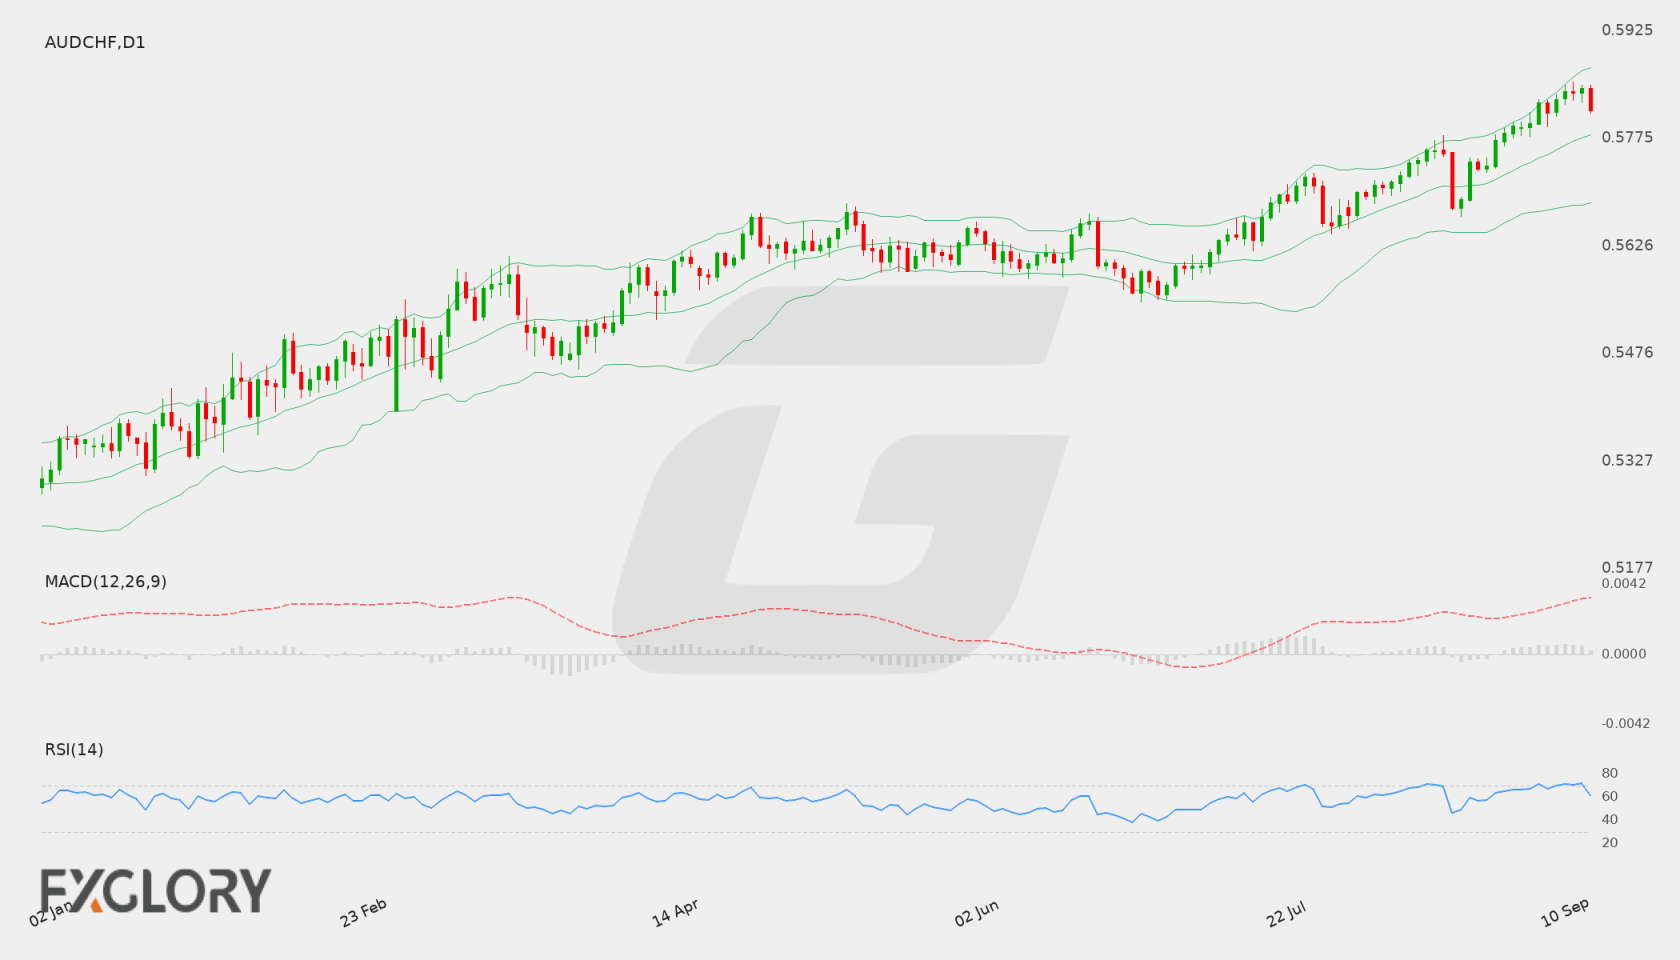
On the daily (D1) timeframe, AUD/CHF recently advanced toward the 0.5849 area before experiencing a mild retracement, bringing the last close to 0.58151. The broader price structure continues to reflect an upward trajectory off previous lows.

Key Technical Indicators:

Bollinger Bands: The Bollinger Bands indicator shows the middle band at 0.57798, with the upper band at 0.58735 and the lower band at 0.56862. Price action trades in the upper half of the band structure, pointing to sustained bullish momentum.

RSI: The 14-day Relative Strength Index (RSI) stands at 61.36, holding comfortably in bullish territory above the neutral 50 level without reaching overbought conditions.

MACD: The daily MACD line remains above zero with a value of 0.00361, signaling ongoing positive momentum in the pair's recent price movement.

Support and Resistance:

Key daily resistance for AUD/CHF is identified at 0.58543, near recent peak highs. On the downside, primary support is located lower at 0.55481.

News to Watch for AUDCHF This Week:

  • PPI m/m: This producer price reading reflects domestic price pressure dynamics that can influence Swiss franc market sentiment.

Weekly Outlook and Consideration:

The daily technical setup for AUD/CHF displays positive momentum, with the pair closing at 0.58151 above its daily middle Bollinger Band of 0.57798. An RSI reading of 61.36 and a positive MACD at 0.00361 support this upside bias. If buyers maintain control, a test of resistance at 0.58543 remains possible. Conversely, a reversal could see the pair move back toward intermediate support levels well above the major technical support at 0.55481.

Disclaimer: The analysis provided for AUD/CHF is for informational purposes only and does not constitute investment advice. Traders are encouraged to perform their own analysis and research before making any trading decisions. Market conditions can change quickly, so staying informed with the latest data is essential.
AUD/CHF D1 technical analysis chart
AUD/CHF D1 Technical Analysis for 09.12.2026

AUD/CHF Forecast — 5 September 2026

Time Zone: GMT +3

Time Frame: Daily (D1) / Weekly Outlook

Weekly Fundamental Overview:

The AUD/CHF pair reflects the balance between risk-sensitive Australian Dollar dynamics and the safe-haven properties of the Swiss Franc. Broader global risk appetite and commodity markets influence the pair, while domestic Swiss factors like producer price changes also play a role in shaping market expectations for monetary policy and currency valuation.

Price Action:

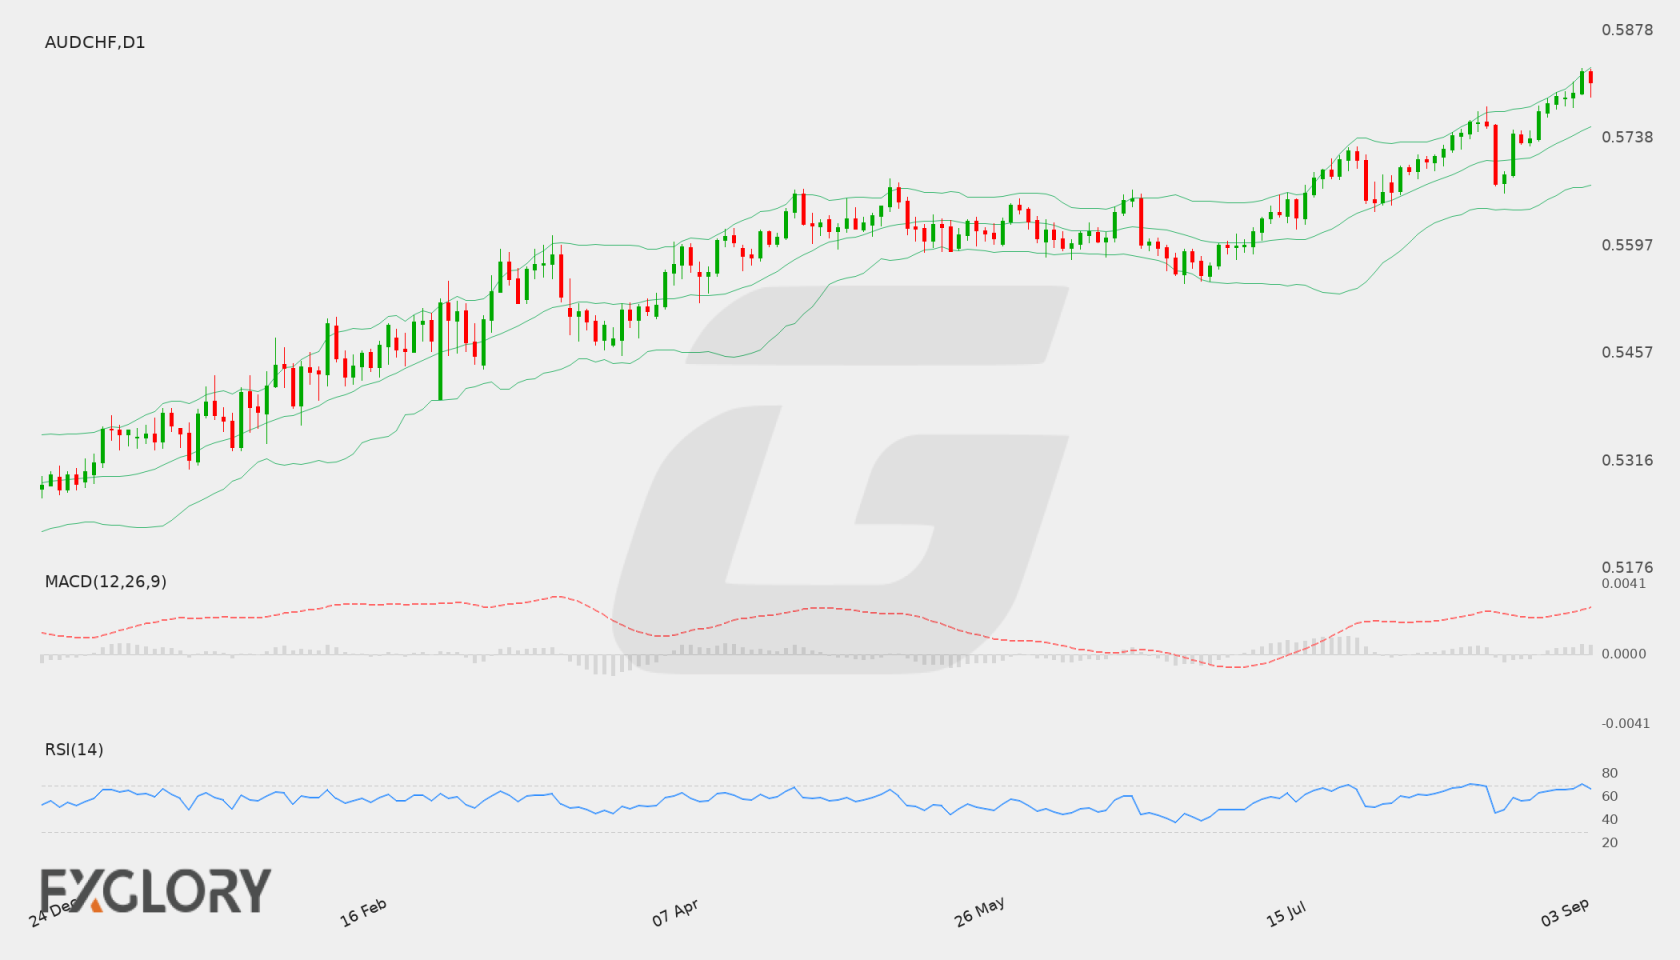
On the daily D1 chart, AUD/CHF has exhibited a steady upward trajectory, moving from recent swing lows toward a recent high near 0.58289 before closing at 0.58119. The recent sequence of higher daily closes highlights persistent buying interest, though price action is approaching critical structural resistance.

Key Technical Indicators:

Bollinger Bands: The daily Bollinger Bands are expanding, with the middle band situated at 0.575298, the lower band at 0.567605, and the upper band at 0.582991. The last close at 0.58119 trades near the upper band, indicating strong bullish momentum and heightened volatility.

RSI: The 14-day Relative Strength Index (RSI) stands at 66.93. Positioned in upper bullish territory below the overbought threshold of 70, the indicator suggests ongoing upward pressure while leaving room for potential price movement in either direction.

MACD: The daily MACD indicator is in positive territory with a reading of 0.003303. This positive value reflects underlying bullish momentum, as short-term moving averages remain positioned above longer-term baseline averages.

Support and Resistance:

Key technical levels for AUD/CHF on the daily timeframe include primary resistance at 0.58289 and a major support level below at 0.55481.

News to Watch for AUDCHF This Week:

  • PPI m/m: This release tracks changes in producer prices, providing insights into wholesale inflation trends that could impact Swiss monetary policy expectations.

Weekly Outlook and Consideration:

The weekly outlook for AUD/CHF remains constructively bullish based on daily chart technicals. With price action near 0.58119, an RSI of 66.93, and a positive MACD of 0.003303, momentum favors buyers as price approaches upper Bollinger Band resistance at 0.582991. A sustained breakout above resistance at 0.58289 could extend upside progression, while any sudden pullbacks may see initial downside cushioned above technical support at 0.55481.

Disclaimer: The analysis provided for AUD/CHF is for informational purposes only and does not constitute investment advice. Traders are encouraged to perform their own analysis and research before making any trading decisions. Market conditions can change quickly, so staying informed with the latest data is essential.

AUD/CHF D1 technical analysis chart
AUD/CHF D1 Technical Analysis for 09.05.2026

AUD/CHF Forecast — 22 August 2026

Time Zone: GMT +3

Time Frame: Daily (D1) / Weekly Outlook

Weekly Fundamental Overview:

The AUD/CHF currency pair reflects market sentiment across the Australian Dollar and Swiss Franc, influenced by upcoming inflation metrics and broader market dynamics. Trader focus remains on economic indicators that could sway underlying demand for both currencies.

Price Action:

On the daily (D1) chart, AUD/CHF recently pulled back from recent daily highs to settle around a close of 0.56900. The recent candlestick activity indicates a corrective movement after price struggled to hold near upper resistance levels.

Key Technical Indicators:

Bollinger Bands: The daily Bollinger Bands present a middle band at 0.57085, with the upper band at 0.57722 and the lower band at 0.56447. The last close at 0.56900 sits slightly below the middle band, signaling neutral to mild downside bias within the current band range.

RSI: The 14-period Relative Strength Index (RSI) stands at 48.64, holding comfortably in neutral territory near the 50 baseline. This signals a balance between buying and selling pressure on the daily timeframe.

MACD: The MACD indicator is currently registered at 0.00191. Holding just above the zero line, it reflects modest positive baseline sentiment but lacks strong momentum following recent price consolidation.

Support and Resistance:

Key daily technical levels for AUD/CHF include a support level at 0.55481 and a resistance level at 0.57787.

News to Watch for AUDCHF This Week:

  • CPI m/m: Tracks monthly consumer price changes influencing Australian monetary policy expectations.
  • Trimmed Mean CPI m/m: Evaluates core inflation trends that offer insight into underlying price pressures.
  • CPI y/y: Reflects annual consumer inflation rates affecting broader valuation of the Australian Dollar.

Weekly Outlook and Consideration:

AUD/CHF trades near 0.56900 with daily indicators pointing toward a neutral environment. The RSI at 48.64 and price positioning near the middle Bollinger Band of 0.57085 suggest potential for range-bound movement between support at 0.55481 and resistance at 0.57787, depending on how upcoming Australian inflation data impacts sentiment.

Disclaimer: The analysis provided for AUD/CHF is for informational purposes only and does not constitute investment advice. Traders are encouraged to perform their own analysis and research before making any trading decisions. Market conditions can change quickly, so staying informed with the latest data is essential.

1AUD = –––CHF –––% ▼
AUDCHF
Loading chart...