Time Zone: GMT +3
Time Frame: Daily (D1) / Weekly Outlook
Weekly Fundamental Overview:
ETH/USD market dynamics remain tied to broader macroeconomic risk sentiment and liquid capital flows influencing the cryptocurrency sector. Upcoming US manufacturing indicators may affect overall dollar strength and market liquidity, impacting investor appetite across risk assets like Ethereum.
Price Action:
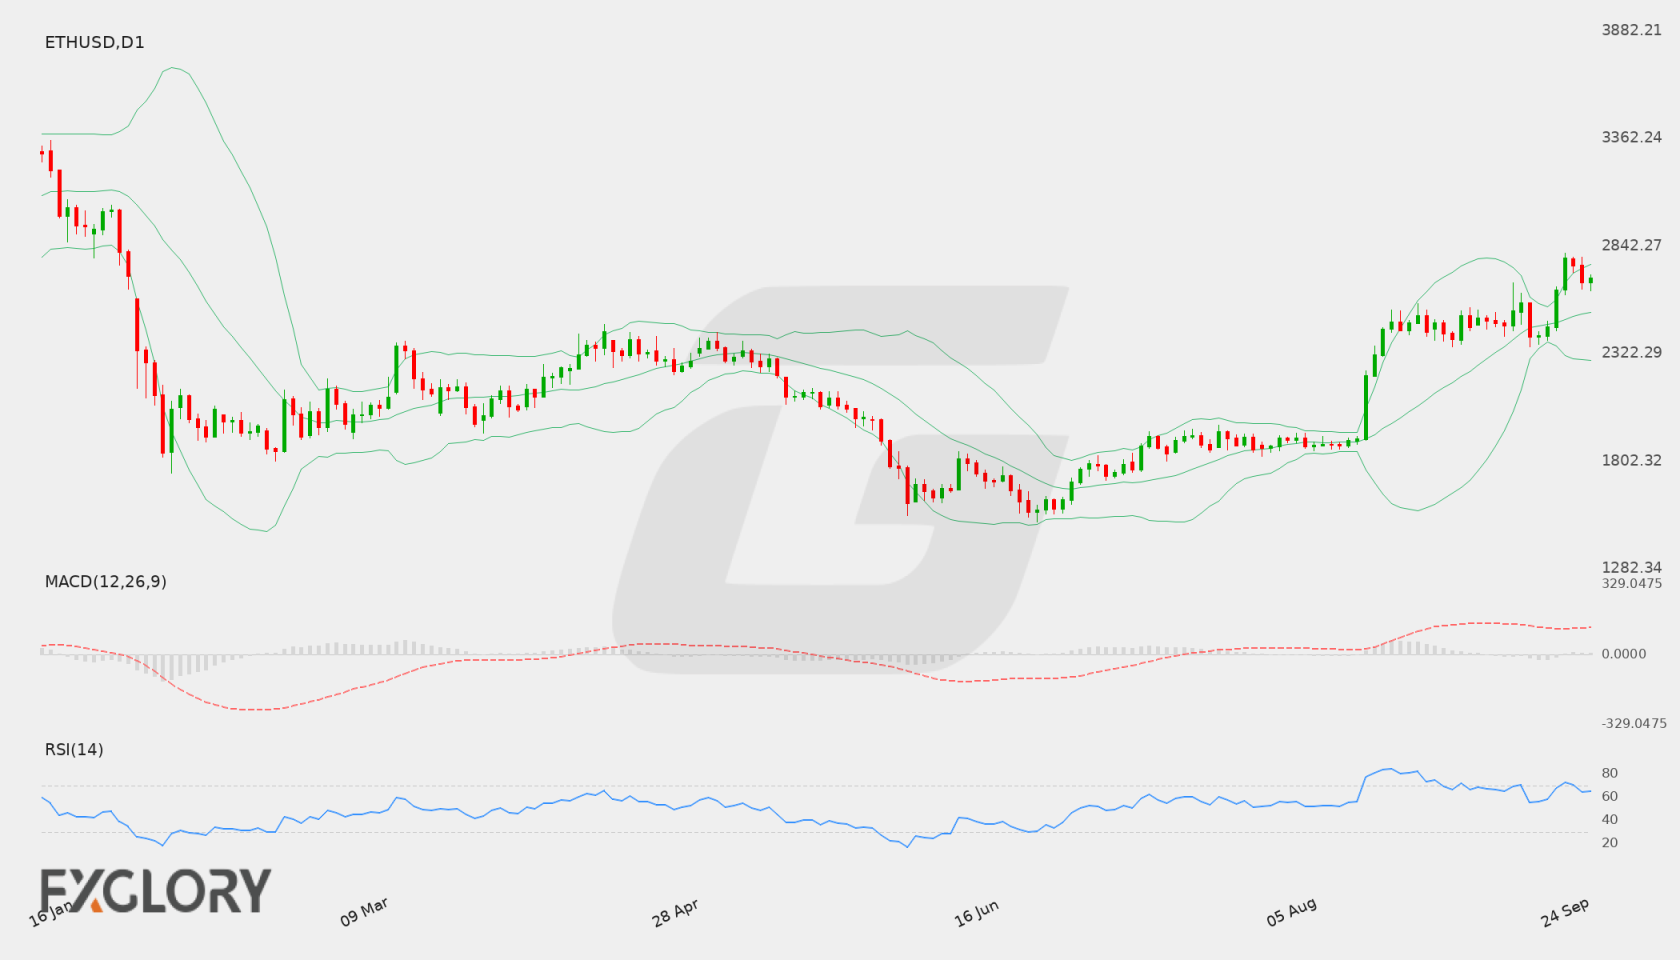
ETH/USD showed a significant upward move on the daily chart, surging from recent lows near 2403.93 up to a high of 2804.97 before settling around 2685.41. The price action demonstrates strong buying pressure during the push upward, followed by a slight consolidation phase near the recent peak.
Key Technical Indicators:
Bollinger Bands: The daily Bollinger Bands highlight elevated volatility. The upper band is situated at 2753.50, the middle band at 2521.59, and the lower band at 2289.68. Trading above the middle band at 2685.41 keeps ETH/USD positioned in the upper portion of its volatility channel.
RSI: The 14-day Relative Strength Index (RSI) stands at 64.52, confirming constructive buying interest while staying comfortably below overbought conditions.
MACD: The MACD indicator registers at 129.20, remaining firmly positive and reflecting sustained bullish momentum on the daily timeframe.
Support and Resistance:
Immediate key resistance is located at 2804.97, corresponding to recent daily peaks. On the downside, broad technical support is identified at 1688.23.
News to Watch for ETHUSD This Week:
- ISM Manufacturing PMI: Shifts in broad manufacturing strength can influence market risk appetite and impact digital asset valuations.
- ISM Manufacturing Prices: Inflationary trends within manufacturing can drive US dollar movements and affect capital allocation to risk assets.
Weekly Outlook and Consideration:
ETH/USD carries positive momentum into the week after testing resistance at 2804.97 and maintaining its ground near 2685.41. With the RSI at 64.52 and MACD at 129.20, technical indicators point to ongoing strength. As long as price holds above the middle Bollinger Band at 2521.59, the constructive bias remains, though macroeconomic releases could induce temporary volatility.
Disclaimer: The analysis provided for ETH/USD is for informational purposes only and does not constitute investment advice. Traders are encouraged to perform their own analysis and research before making any trading decisions. Market conditions can change quickly, so staying informed with the latest data is essential.