Time Zone: GMT +3
Time Frame: Daily (D1) / Weekly Outlook
Weekly Fundamental Overview:
The NZD/USD currency pair remains under pressure as broader macroeconomic dynamics continue to weigh on market sentiment. Traders are closely evaluating economic conditions affecting both the New Zealand Dollar and the US Dollar, keeping a close eye on central bank expectations and general risk appetite.
Price Action:
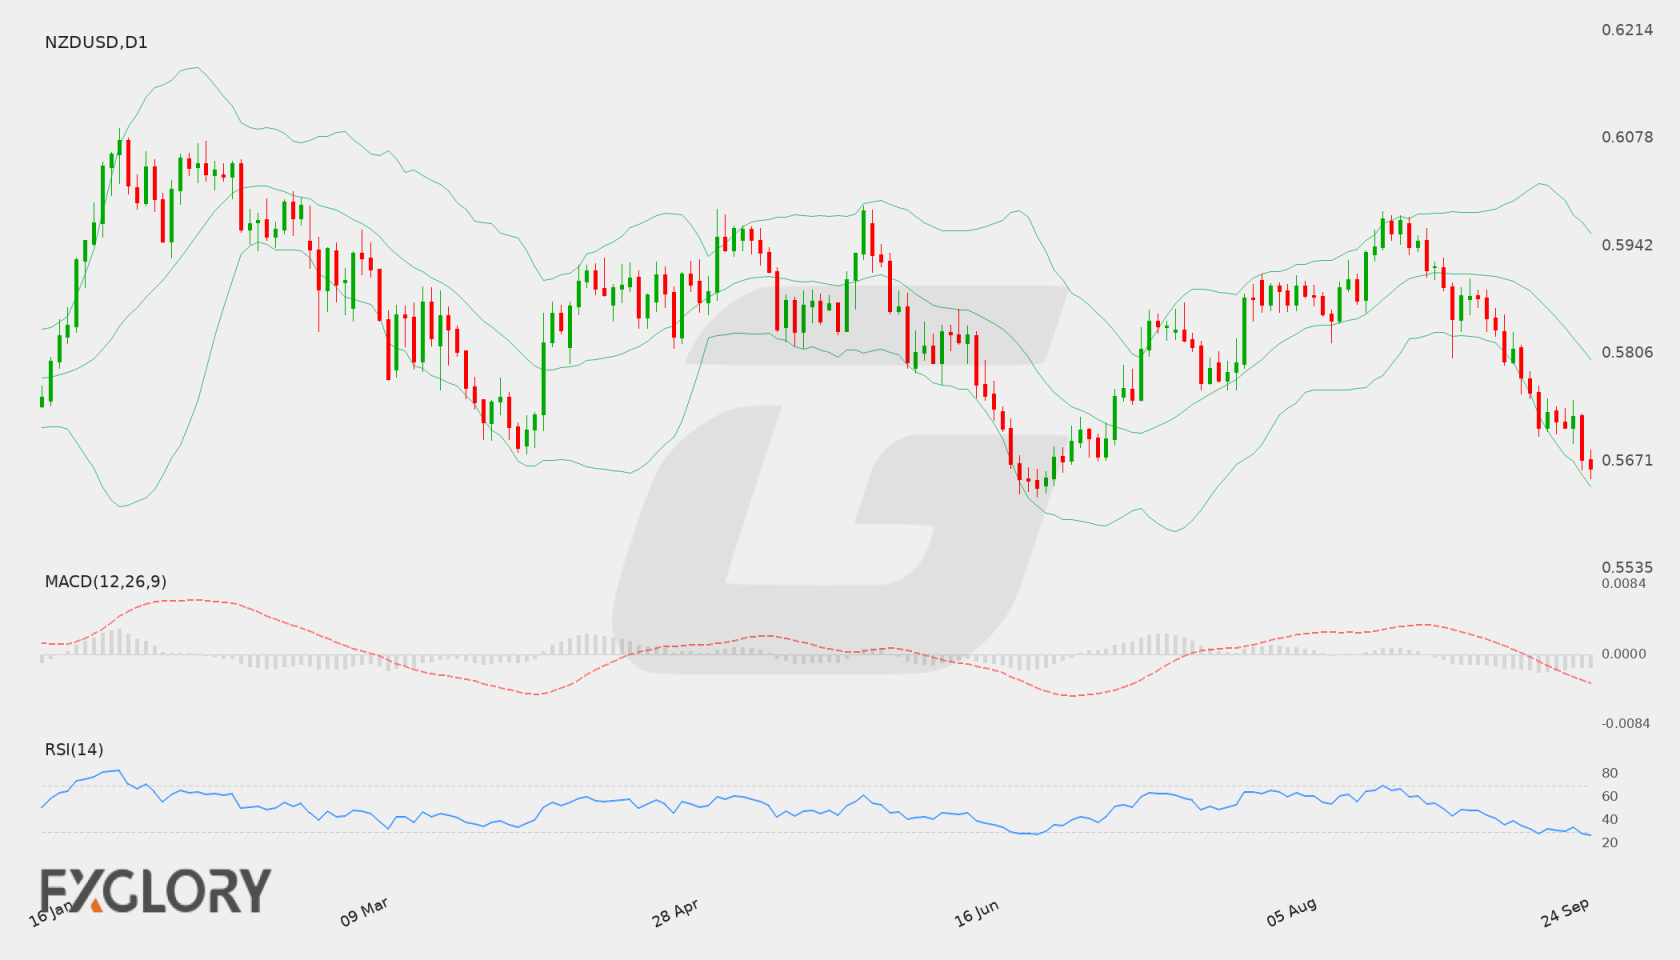
On the Daily (D1) timeframe, NZD/USD has displayed persistent weakness, declining from recent trading ranges to register a latest close at 0.56606. The series of lower daily closes reflects prevailing selling interest, compressing price action near recent session lows.
Key Technical Indicators:
Bollinger Bands: The Bollinger Bands indicator shows a middle band at 0.57984, an upper band at 0.59588, and a lower band at 0.56380. With the current close at 0.56606, NZD/USD is trading near the lower band, reflecting strong downside volatility.
RSI: The 14-period Relative Strength Index (RSI) is currently reading 27.13. Moving below the 30 level places the pair in oversold territory, suggesting that downside momentum is stretched on the daily chart.
MACD: The Moving Average Convergence Divergence (MACD) on the daily chart stands at -0.00514. This negative value indicates ongoing bearish momentum for NZD/USD as the signal remains firmly in negative territory.
Support and Resistance:
Immediate key technical support for NZD/USD is located at 0.56482, offering potential downside stabilization. On the upside, primary technical resistance is established at 0.5986.
News to Watch for NZDUSD This Week:
- ISM Manufacturing PMI: Reflects the overall performance of the US manufacturing sector and can drive fluctuations in the US Dollar.
- ISM Manufacturing Prices: Highlights price trends and inflationary pressures within manufacturing that may affect broader currency valuation.
Weekly Outlook and Consideration:
The D1 technical profile for NZD/USD remains tilted to the downside, underlined by a negative MACD of -0.00514 and price action anchored near the lower Bollinger Band of 0.56380. Although an RSI reading of 27.13 highlights oversold conditions that could allow for temporary consolidation, key resistance at 0.5986 presents a significant obstacle for buyers. A sustained breach of support at 0.56482 would signal further weakness, while a recovery toward the 0.57984 middle band would require renewed buying momentum.
Disclaimer: The analysis provided for NZD/USD is for informational purposes only and does not constitute investment advice. Traders are encouraged to perform their own analysis and research before making any trading decisions. Market conditions can change quickly, so staying informed with the latest data is essential.